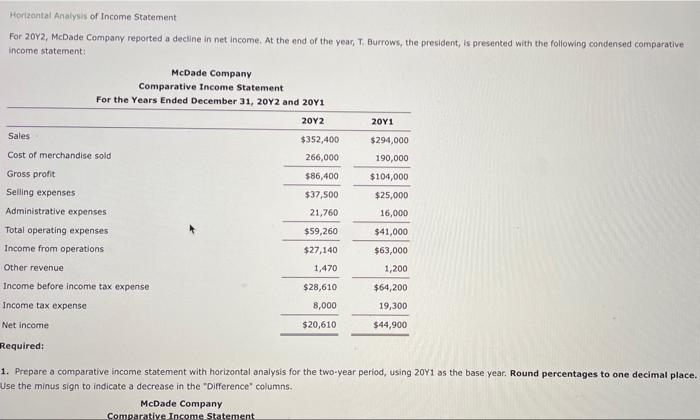
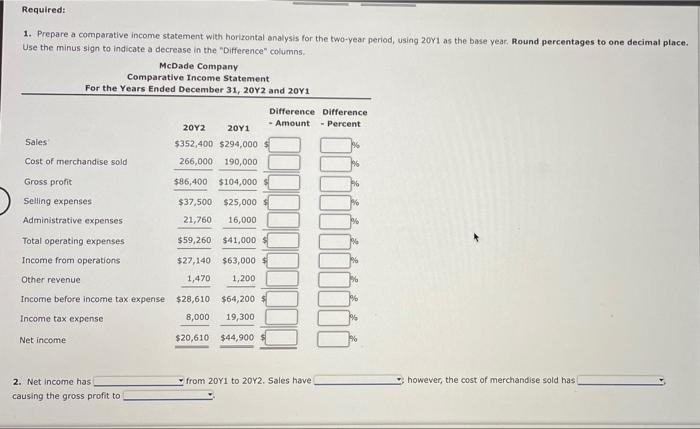
Horizontal Analysis of Income Statement For 2012, McDade Company reported a decline in net income. At the end of the year, T. Burrows, the president, is presented with the following condensed comparative income statement McDade Company Comparative Income Statement For the Years Ended December 31, 2012 and 2041 2012 2011 Sales $352,400 266,000 Cost of merchandise sold $294,000 190,000 $104,000 $86,400 Gross profit Seling expenses Administrative expenses $37,500 21,760 $25,000 16,000 $41,000 Total operating expenses Income from operations $59,260 $27,140 1,470 $63,000 1,200 Other revenue Income before income tax expense Income tax expense $28,610 8,000 $20,610 $64,200 19,300 $44,900 Net Income Required: 1. Prepare a comparative income statement with horizontal analysis for the two-year period, using 2011 as the base year. Round percentages to one decimal place. Use the minus sign to indicate a decrease in the Difference columns. McDade Company Comparative Income Statement Required: 1. Prepare a comparative income statement with horizontal analysis for the two-year period, using 2011 as the base year. Round percentages to one decimal place. Use the minus sign to indicate a decrease in the "Difference" columns McDade Company Comparative Income Statement For the Years Ended December 31, 2012 and 2011 Difference Difference 2012 2011 - Amount - Percent Sales $352,400 $294,000 Cost of merchandise sold 266,000 190,000 Gross profit $86,400 $104,000 Selling expenses Administrative expenses $37,500 $25,000 21,760 16,000 $59,260 $41,000 Total operating expenses Income from operations $27,140 1,470 $63,000 1,200 Other revenue Income before income tax expense $28,610 $64,200 Income tax expense 8,000 19,300 Net income $20,610 $44,900 w from 2011 to 2012. Sales have however, the cost of merchandise sold has 2. Net Income has causing the gross profit to