

Answered step by step
Verified Expert Solution
Question
1 Approved Answer
Horizontal Analysis of the income statement for Target Corporation for 2017 and 2018 .A table that shows the comparative balance sheet for 2017 and 2018.
Horizontal Analysis of the income statement for Target Corporation for 2017 and 2018 .A table that shows the comparative balance sheet for 2017 and 2018. Must include collumn dollar amount and percentage change as well. Following table, Observation and analysis noticed? risks or concerns? 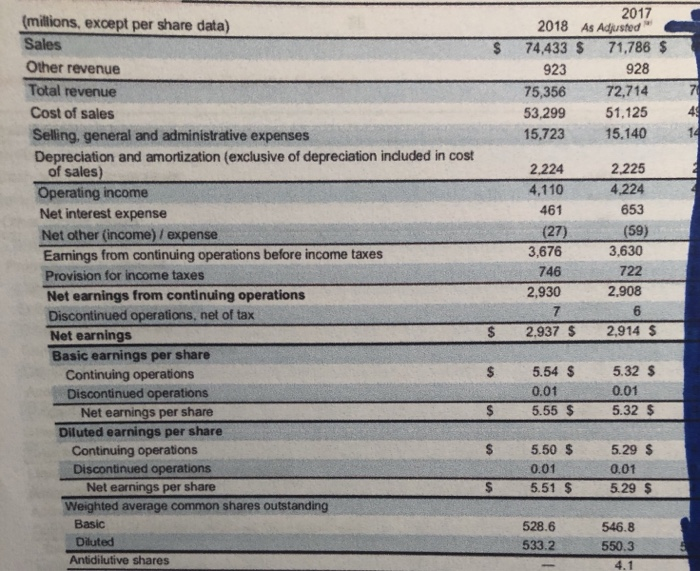
*not the income statement . I meant Balance sheet for Target Corp for 2017-2018. The second photo is the balance sheet 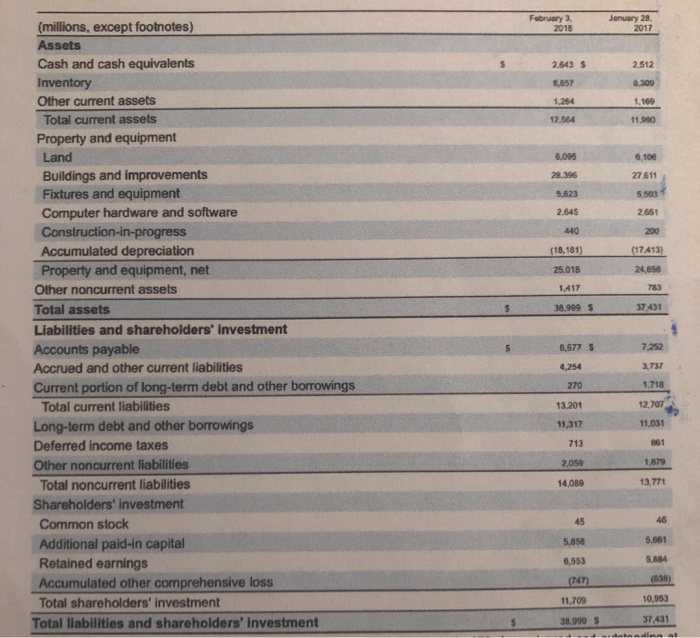
in the second picture in the balance sheet for Target Corporation , 2017 and 2018 . A horizontal analysis of the balance sheet needs to be made . A table that shows the comparative balance between both years as well as a column for dollar and percentage amount then explain observations and analysis . 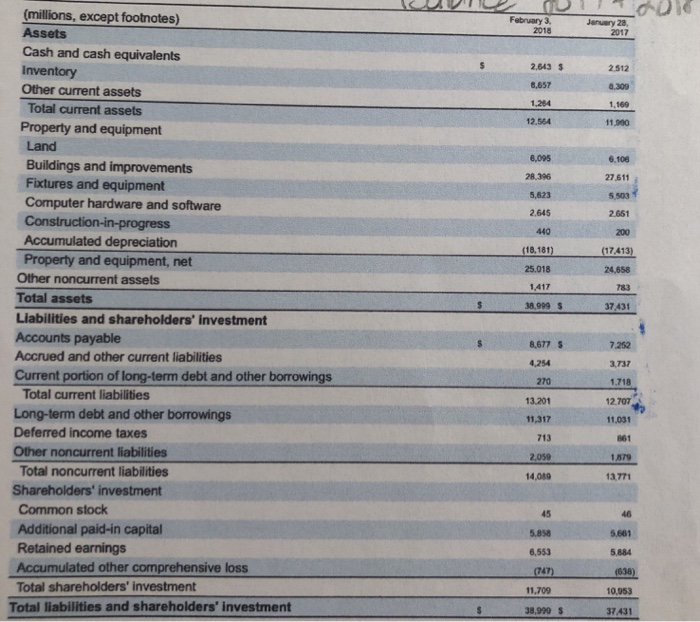
2017 2018 As Adjusted 71,786 $ (millions, except per share data) Sales 74,433 $ Other revenue 923 928 Total revenue 7 49 14 72,714 75,356 Cost of sales 53,299 51,125 15.140 Selling, general and administrative expenses Depreciation and amortization (exclusive of depreciation included in cost of sales) Operating income Net interest expense 15,723 2,225 2.224 4.224 4,110 653 461 (27) (59) 3,630 Net other (income)/ expense Eamings from continuing operations before income taxes 3,676 722 746 Provision for income taxes 2.908 2,930 Net earnings from continuing operations Discontinued operations, net of tax Net earnings 6 7 $ 2,937 $ 2,914 $ Basic earnings per share 5.32 $ 5.54 $ Continuing operations Discontinued operations Net earnings per share Diluted earnings per share Continuing operations Discontinued operations 0.01 0.01 5.32 $ 5.55 $ 5.50 $ 5.29 $ 0.01 0.01 Net earnings per share 5.51 $ 5.29 $ Weighted average common shares outstanding Basic 528.6 546.8 Diluted 533.2 550.3 Antidilutive shares 4.1 February 3, January 28, 2017 (millions, except footnotes) 2018 Assets Cash and cash equivalents 2.512 2.643 S Inventory 8,309 8.857 Other current assets 1,169 1,264 Total current assets 12.564 11.990 Property and equipment Land 8,095 6.106 Buildings and improvements Fixtures and equipment 28,396 27611 5 503 5,623 Computer hardware and software Construction-in-progress Accumulated depreciation Property and equipment, net 2.645 2.651 440 200 (17.413) (18,181) 25.018 24,658 Other noncurrent assets 783 1,417 37,431 Total assets 38.999 $ Liabilities and shareholders' investment Accounts payable 8,677 $ 7,252 Accrued and other current liabilities 4,254 3,737 Current portion of long-term debt and other borrowings Total current liabilities 1.718 270 12,707 13.201 Long-term debt and other borrowings 11,317 11,031 861 Deferred income taxes 713 1,879 2,059 Other noncurrent liabilities 13,771 Total noncurrent liabilities 14,089 Shareholders' investment 46 Common stock 45 5,661 Additional paid-in capital Retained earnings 5,858 5,884 6,553 (638) Accumulated other comprehensive loss (747) 10,053 Total shareholders' investment 11,709 37,431 Total liabilities and shareholders' investment 38.999 S datondina at (millions, except footnotes) Assets Cash and cash equivalents February 3, 2018 January 28, 2017 2.643 $ Inventory 2512 8,657 Other current assets 8.309 1,264 1,169 Total current assets 12.564 11.900 Property and equipment Land 6,095 6.106 Buildings and improvements Fixtures and equipment 28,396 27,611 5,623 5,503 Computer hardware and software Construction-in-progress Accumulated depreciation Property and equipment, net Other noncurrent assets 2.645 2.651 440 200 (18,181) (17,413) 25.018 24,658 1,417 783 Total assets 38,999 $ 37,431 Liabilities and shareholders' investment Accounts payable 8,677 7.252 Accrued and other current liabilities 4,254 3,737 Current portion of long-term debt and other borrowings Total current liabilities 1.718 270 12.707) 13.201 Long-term debt and other borrowings Deferred income taxes 11,317 11,031 713 861 Other noncurrent liabilities 2,059 1,879 Total noncurrent liabilities 14,089 13771 Shareholders' investment Common stock 46 45 Additional paid-in capital Retained earnings 5,858 5,661 6,553 5,884 Accumulated other comprehensive loss (747) (638) Total shareholders' investment 11,709 10,953 Total liabilities and shareholders' investment 38,999 $ 37431 Step by Step Solution
There are 3 Steps involved in it
Step: 1

Get Instant Access to Expert-Tailored Solutions
See step-by-step solutions with expert insights and AI powered tools for academic success
Step: 2

Step: 3
Ace Your Homework with AI
Get the answers you need in no time with our AI-driven, step-by-step assistance
Get Started
The People Policies Audit
Authors: Maurice A. Phelps
1st Edition
1907766049, 978-1907766046