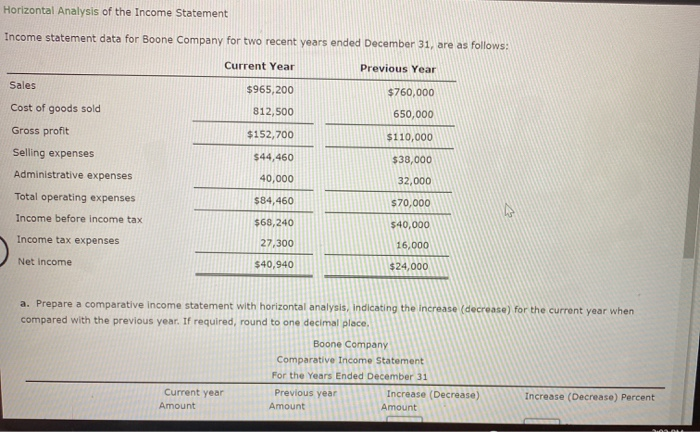
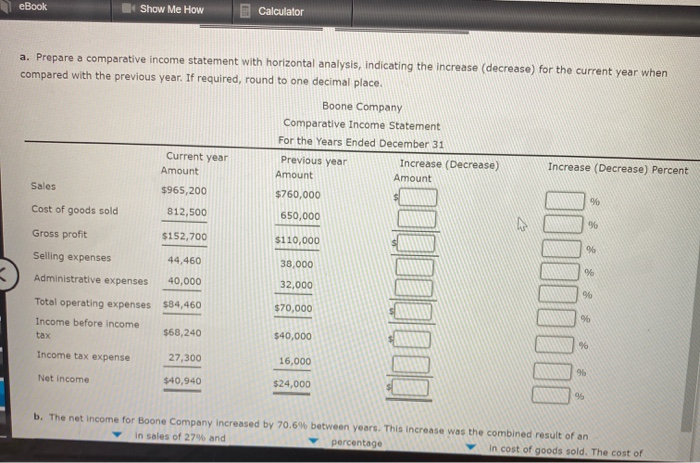
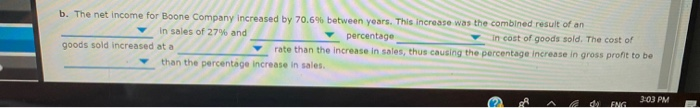
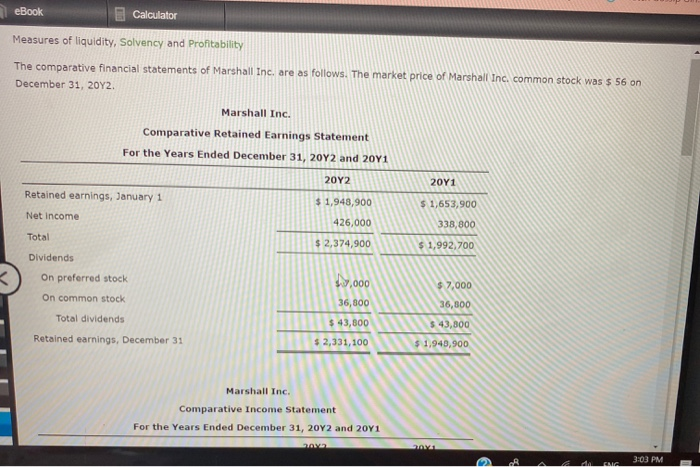
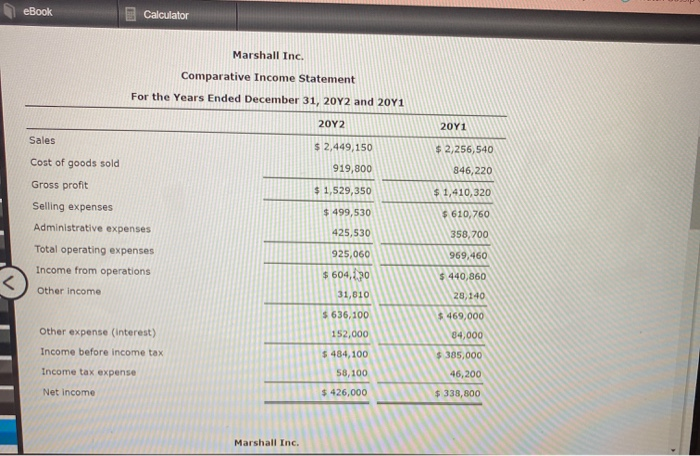
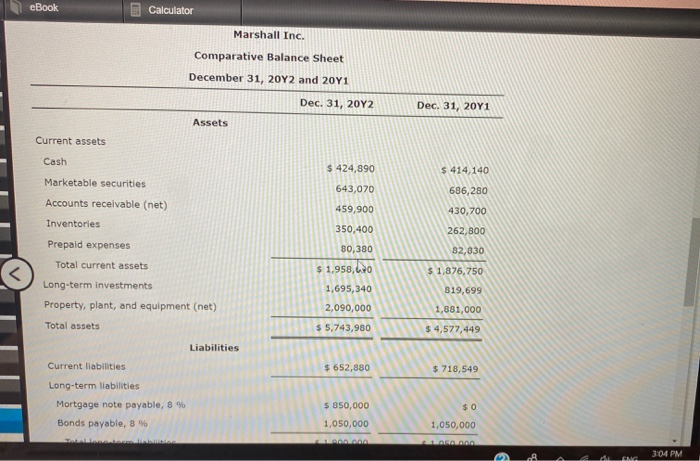
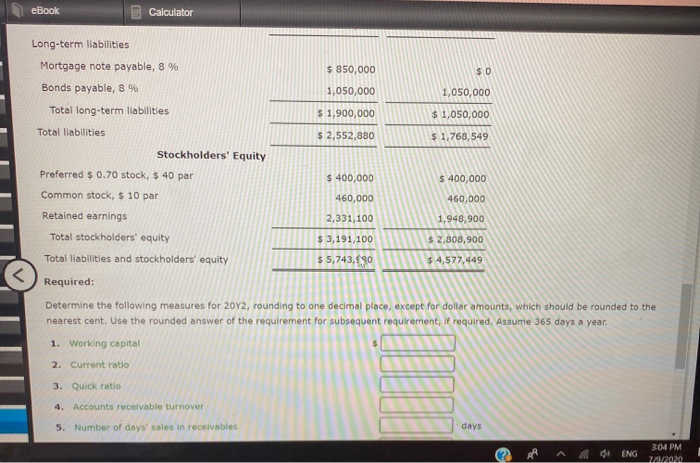
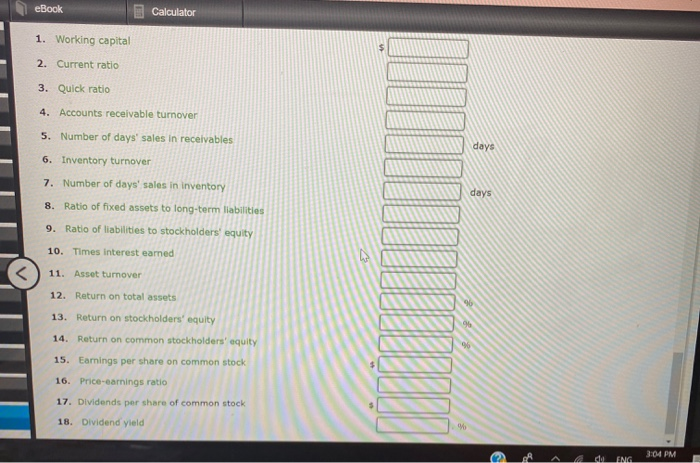
Horizontal Analysis of the Income Statement Income statement data for Boone Company for two recent years ended December 31, are as follows: Current Year Previous Year Sales $965,200 $760,000 Cost of goods sold 812,500 650,000 Gross profit $152,700 $110,000 Selling expenses $44,460 $38,000 Administrative expenses 40,000 32,000 Total operating expenses $84,460 $70,000 Income before income tax $68,240 Income tax expenses $40,000 16,000 27,300 Net Income $40,940 $24,000 a. Prepare a comparative Income statement with horizontal analysis, indicating the increase (decrease) for the current year when compared with the previous year. If required, round to one decimal place, Boone Company Comparative Income Statement For the Years Ended December 31 Previous year Increase (Decrease) Amount Amount Current year Amount Increase (Decrease) Percent eBook Show Me How Calculator a. Prepare a comparative income statement with horizontal analysis, indicating the increase (decrease) for the current year when compared with the previous year. If required, round to one decimal place. Boone Company Comparative Income Statement For the Years Ended December 31 Current year Previous year Increase (Decrease) Increase (Decrease) Percent Amount Amount Amount Sales $965,200 $760,000 96 Cost of goods sold 812,500 650,000 he 96 Gross profit $152,700 $110,000 96 Selling expenses 44,460 38,000 96 Administrative expenses 40,000 32,000 9% $70,000 Total operating expenses $34,460 Income before income $68,240 tax %6 $40,000 96 Income tax expense JOON 27,300 16,000 96 Net income $40,940 $24,000 95 b. The net income for Boone Company increased by 70.6% between years. This increase was the combined result of an in sales of 27% and percentage In cost of goods sold. The cost of b. The net income for Boone Company increased by 70.6% between years. This increase was the combined result of an in sales of 27% and percentage In cost of goods sold. The cost of goods sold increased at a rate than the increase in sales, thus causing the percentage increase in gross pront to be than the percentage increase in sales A MENG 3:03 PM eBook Calculator Measures of liquidity, Solvency and Profitability The comparative financial statements of Marshall Inc. are as follows. The market price of Marshall Inc. common stock was $ 56 on December 31, 2012 Marshall Inc. Comparative Retained Earnings Statement For the Years Ended December 31, 20Y2 and 20Y1 20Y2 20Y1 Retained earnings, January 1 $ 1,653,900 $ 1,943,900 426,000 Net Income 338,800 Total $ 2,374,900 $ 1,992,700 Dividends 19,000 $ 7,000 On preferred stock On common stock Total dividends 36,800 36,800 $ 43,800 $ 43,800 Retained earnings, December 31 $ 2,331,100 $ 1,940,900 Marshall Inc. Comparative Income Statement For the Years Ended December 31, 2012 and 2041 Audi ANG 3:03 PM eBook Calculator Marshall Inc. Comparative Income Statement For the Years Ended December 31, 20Y2 and 2041 20Y2 20Y1 Sales $ 2,449,150 $2,256,540 Cost of goods sold 919,800 846,220 Gross profit $ 1,529,350 $ 1,410,320 $ 499,530 $ 610,760 425,530 Selling expenses Administrative expenses Total operating expenses Income from operations 358,700 969,460 925,060 $ 604,230 31,810 $ 440,860 Other Income 28,140 $636,100 $469,000 34,000 Other expense (interest) Income before income tax 152,000 $ 484,100 $385,000 Income tax expense 58,100 46,200 Net income $ 426,000 $ 338,800 Marshall Inc. eBook Calculator Marshall Inc. Comparative Balance Sheet December 31, 2012 and 20Y1 Dec. 31, 2012 Dec 31, 2011 Assets Current assets Cash $ 424,890 $ 414,140 643,070 686,280 Marketable securities Accounts receivable (net) Inventories Prepaid expenses 459,900 430,700 350,400 262,800 80,380 82,830 Total current assets $ 1,958,60 $ 1,876,750 1,695,340 819,699 Long-term investments Property, plant, and equipment (net) Total assets 2,090,000 1,881,000 $ 5,743,980 $ 4,577,449 Liabilities Current liabilities $ 652,880 $ 718,549 Long-term liabilities Mortgage note payable, 8 % $ 850,000 $0 Bonds payable, 8 % 1,050,000 1,050,000 LARRA CLARO 3:04 PM eBook Calculator Long-term liabilities $ 850,000 $0 Mortgage note payable, 8 % Bonds payable, 8 % 1,050,000 1,050,000 Total long-term liabilities $ 1,900,000 $ 1,050,000 Total liabilities $ 2,552,880 $ 1,768,549 Stockholders' Equity Preferred $ 0.70 stock, $ 40 par $ 400,000 $ 400,000 Common stock, $ 10 par 460,000 460,000 Retained earnings 2,331,100 1,948,900 Total stockholders' equity $ 3,191,100 $ 2,808,900 Total liabilities and stockholders' equity $5,743,30 $ 4,577,449 Required: Determine the following measures for 2012, rounding to one decimal place, except for dollar amounts, which should be rounded to the nearest cent. Use the rounded answer of the requirement for subsequent requirement, if required. Assume 365 days a year. 1. Working capital