

Horizontal Analysis The comparative temporary investments and inventory balances of a company follow: Current Year Previous Year Accounts payable $81,534 $76,200 Long-term debt 31,894 43,100
Horizontal Analysis
The comparative temporary investments and inventory balances of a company follow:
| Current Year | Previous Year | |
| Accounts payable | $81,534 | $76,200 |
| Long-term debt | 31,894 | 43,100 |
Based on this information, what is the amount and percentage of increase or decrease that would be shown on a balance sheet with horizontal analysis? (please show work thanks )
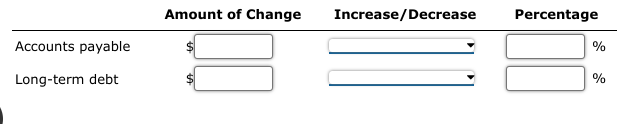 \begin{tabular}{lcll} & Amount of Change & Increase/Decrease & Percentage \\ \hline Accounts payable & $ & & \\ Long-term debt & $ & & \end{tabular}
 Step by Step Solution
There are 3 Steps involved in it
Step: 1

See step-by-step solutions with expert insights and AI powered tools for academic success
Step: 2

Step: 3
Ace Your Homework with AI
Get the answers you need in no time with our AI-driven, step-by-step assistance
Get Started
Authors: Internal Revenue Service
1st Edition
978-1304135087