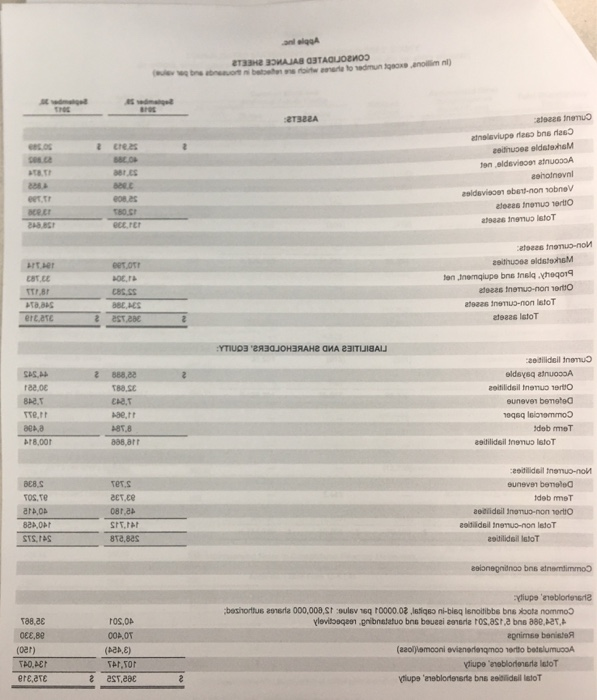
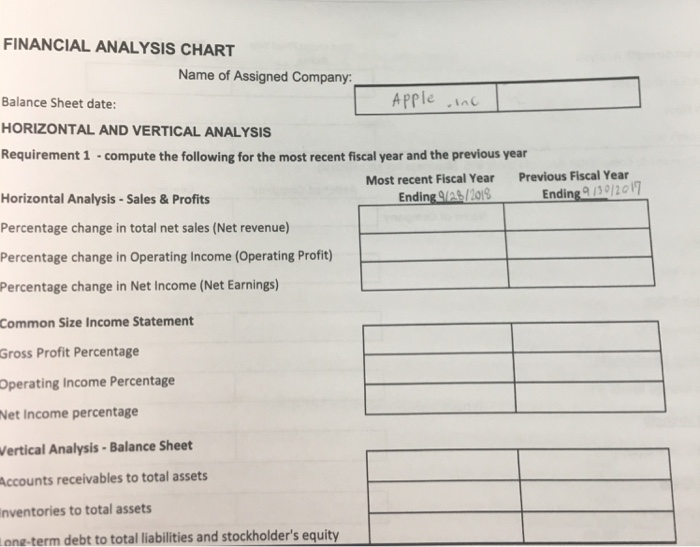
horizontal and vertical analysis chart of Apple inc. consolidaded valance sheet

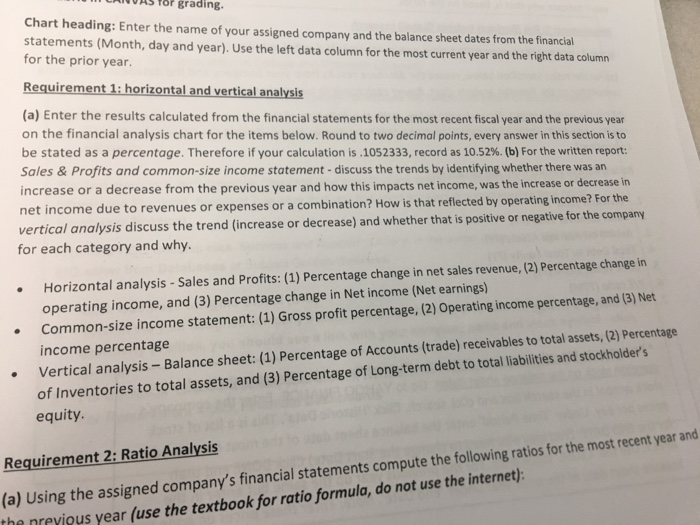
AITOAS for grading Chart heading: Enter the name of your assigned company and the balance sheet dates from the financial statements (Month, day and year). Use the left data column for the most current year and the right data column for the prior year. Requirement 1: horizontal and vertical analysis (a) Enter the results calculated from the financial statements for the most recent fiscal year and the previous year on the financial analysis chart for the items below. Round to two decimal points, every answer in this section is to be stated as a percentage. Therefore if your calculation is .1052333, record as 10.52%. (b) For the written report: Sales & Profits and common-size income statement - discuss the trends by identifying whether there was an increase or a decrease from the previous year and how this impacts net income, was the increase or decrease in net income due to revenues or expenses or a combination? How is that reflected vertical analysis discuss the trend (increase or decrease) and whether that is positive or negative for the company by operating income? For for each category and why. .Horizontal analysis -Sales and Profits: (1) Percentage change in net sales revenue, (2) Percentage change in operating income, and (3) Percentage change in Net income (Net earnings) Common-size income statement: (1) Gross profit percentage, (2) Operating income percentage, and (3) Net income percentage Vertical analysis - Balance sheet: (1) Percen of Inventories to total assets, and (3) Percentage of Long-term debt to total liabilities and stockholder's equity tage of Accounts (trade) receivables to total assets, (2) Percentage . Requirement 2: Ratio Analysis (a) Using the assigned company's financial statements compute the following ratios for the most recent year and the nreyious year (use the textbook for ratio formula, do not use the internet): creas eethupes eldstexheM eet,tr CREt ece.rer zethuoee eldstohsM eet ott ces.ss ateaas latoT ert ete 2 eST 28e eeitilidsil tnemuo Terto reeoe euneven bemeteO 8A2. Te,rr deb meT 888,arr 8,00 t aedilideil tnemus letoT eedilideil tnemuo-not 08.S TOS.Te Ters eET.ER euneven bemele tdeb rmeT eedilidsil lstoT 8Te,ses STS,IAS eeionegndnoo bns atnemtimmo ros,op 0OA OT (pen,8 OEe,8e oer) egnimse benisteA FINANCIAL ANALYSIS CHART Name of Assigned Company: Apple n Balance Sheet date: HORIZONTAL AND VERTICAL ANALYSIS Requirement 1 -compute the following for the most recent fiscal year and the previous year Horizontal Analysis -Sales & Profits Percentage change in total net sales (Net revenue) Percentage change in Operating Income (Operating Profit) Percentage change in Net Income (Net Earnings) Common Size Income Statement Gross Profit Percentage Previous Fiscal Year Most recent Fiscal Year Ending 9 130/201 Income Percentage Operating Income percentage Vertical Analysis-Balance Sheet ccounts receivables to total assets nventories to total assets one-term debt to total liabilities and stockholder's equity Net AITOAS for grading Chart heading: Enter the name of your assigned company and the balance sheet dates from the financial statements (Month, day and year). Use the left data column for the most current year and the right data column for the prior year. Requirement 1: horizontal and vertical analysis (a) Enter the results calculated from the financial statements for the most recent fiscal year and the previous year on the financial analysis chart for the items below. Round to two decimal points, every answer in this section is to be stated as a percentage. Therefore if your calculation is .1052333, record as 10.52%. (b) For the written report: Sales & Profits and common-size income statement - discuss the trends by identifying whether there was an increase or a decrease from the previous year and how this impacts net income, was the increase or decrease in net income due to revenues or expenses or a combination? How is that reflected vertical analysis discuss the trend (increase or decrease) and whether that is positive or negative for the company by operating income? For for each category and why. .Horizontal analysis -Sales and Profits: (1) Percentage change in net sales revenue, (2) Percentage change in operating income, and (3) Percentage change in Net income (Net earnings) Common-size income statement: (1) Gross profit percentage, (2) Operating income percentage, and (3) Net income percentage Vertical analysis - Balance sheet: (1) Percen of Inventories to total assets, and (3) Percentage of Long-term debt to total liabilities and stockholder's equity tage of Accounts (trade) receivables to total assets, (2) Percentage . Requirement 2: Ratio Analysis (a) Using the assigned company's financial statements compute the following ratios for the most recent year and the nreyious year (use the textbook for ratio formula, do not use the internet): creas eethupes eldstexheM eet,tr CREt ece.rer zethuoee eldstohsM eet ott ces.ss ateaas latoT ert ete 2 eST 28e eeitilidsil tnemuo Terto reeoe euneven bemeteO 8A2. Te,rr deb meT 888,arr 8,00 t aedilideil tnemus letoT eedilideil tnemuo-not 08.S TOS.Te Ters eET.ER euneven bemele tdeb rmeT eedilidsil lstoT 8Te,ses STS,IAS eeionegndnoo bns atnemtimmo ros,op 0OA OT (pen,8 OEe,8e oer) egnimse benisteA FINANCIAL ANALYSIS CHART Name of Assigned Company: Apple n Balance Sheet date: HORIZONTAL AND VERTICAL ANALYSIS Requirement 1 -compute the following for the most recent fiscal year and the previous year Horizontal Analysis -Sales & Profits Percentage change in total net sales (Net revenue) Percentage change in Operating Income (Operating Profit) Percentage change in Net Income (Net Earnings) Common Size Income Statement Gross Profit Percentage Previous Fiscal Year Most recent Fiscal Year Ending 9 130/201 Income Percentage Operating Income percentage Vertical Analysis-Balance Sheet ccounts receivables to total assets nventories to total assets one-term debt to total liabilities and stockholder's equity Net


