

Question
Horizontal and Vertical Analysis. Horizontal analysis refers to changes of financial statement numbers and ratios across two or more years. Vertical analysis refers to financial
Horizontal and Vertical Analysis.
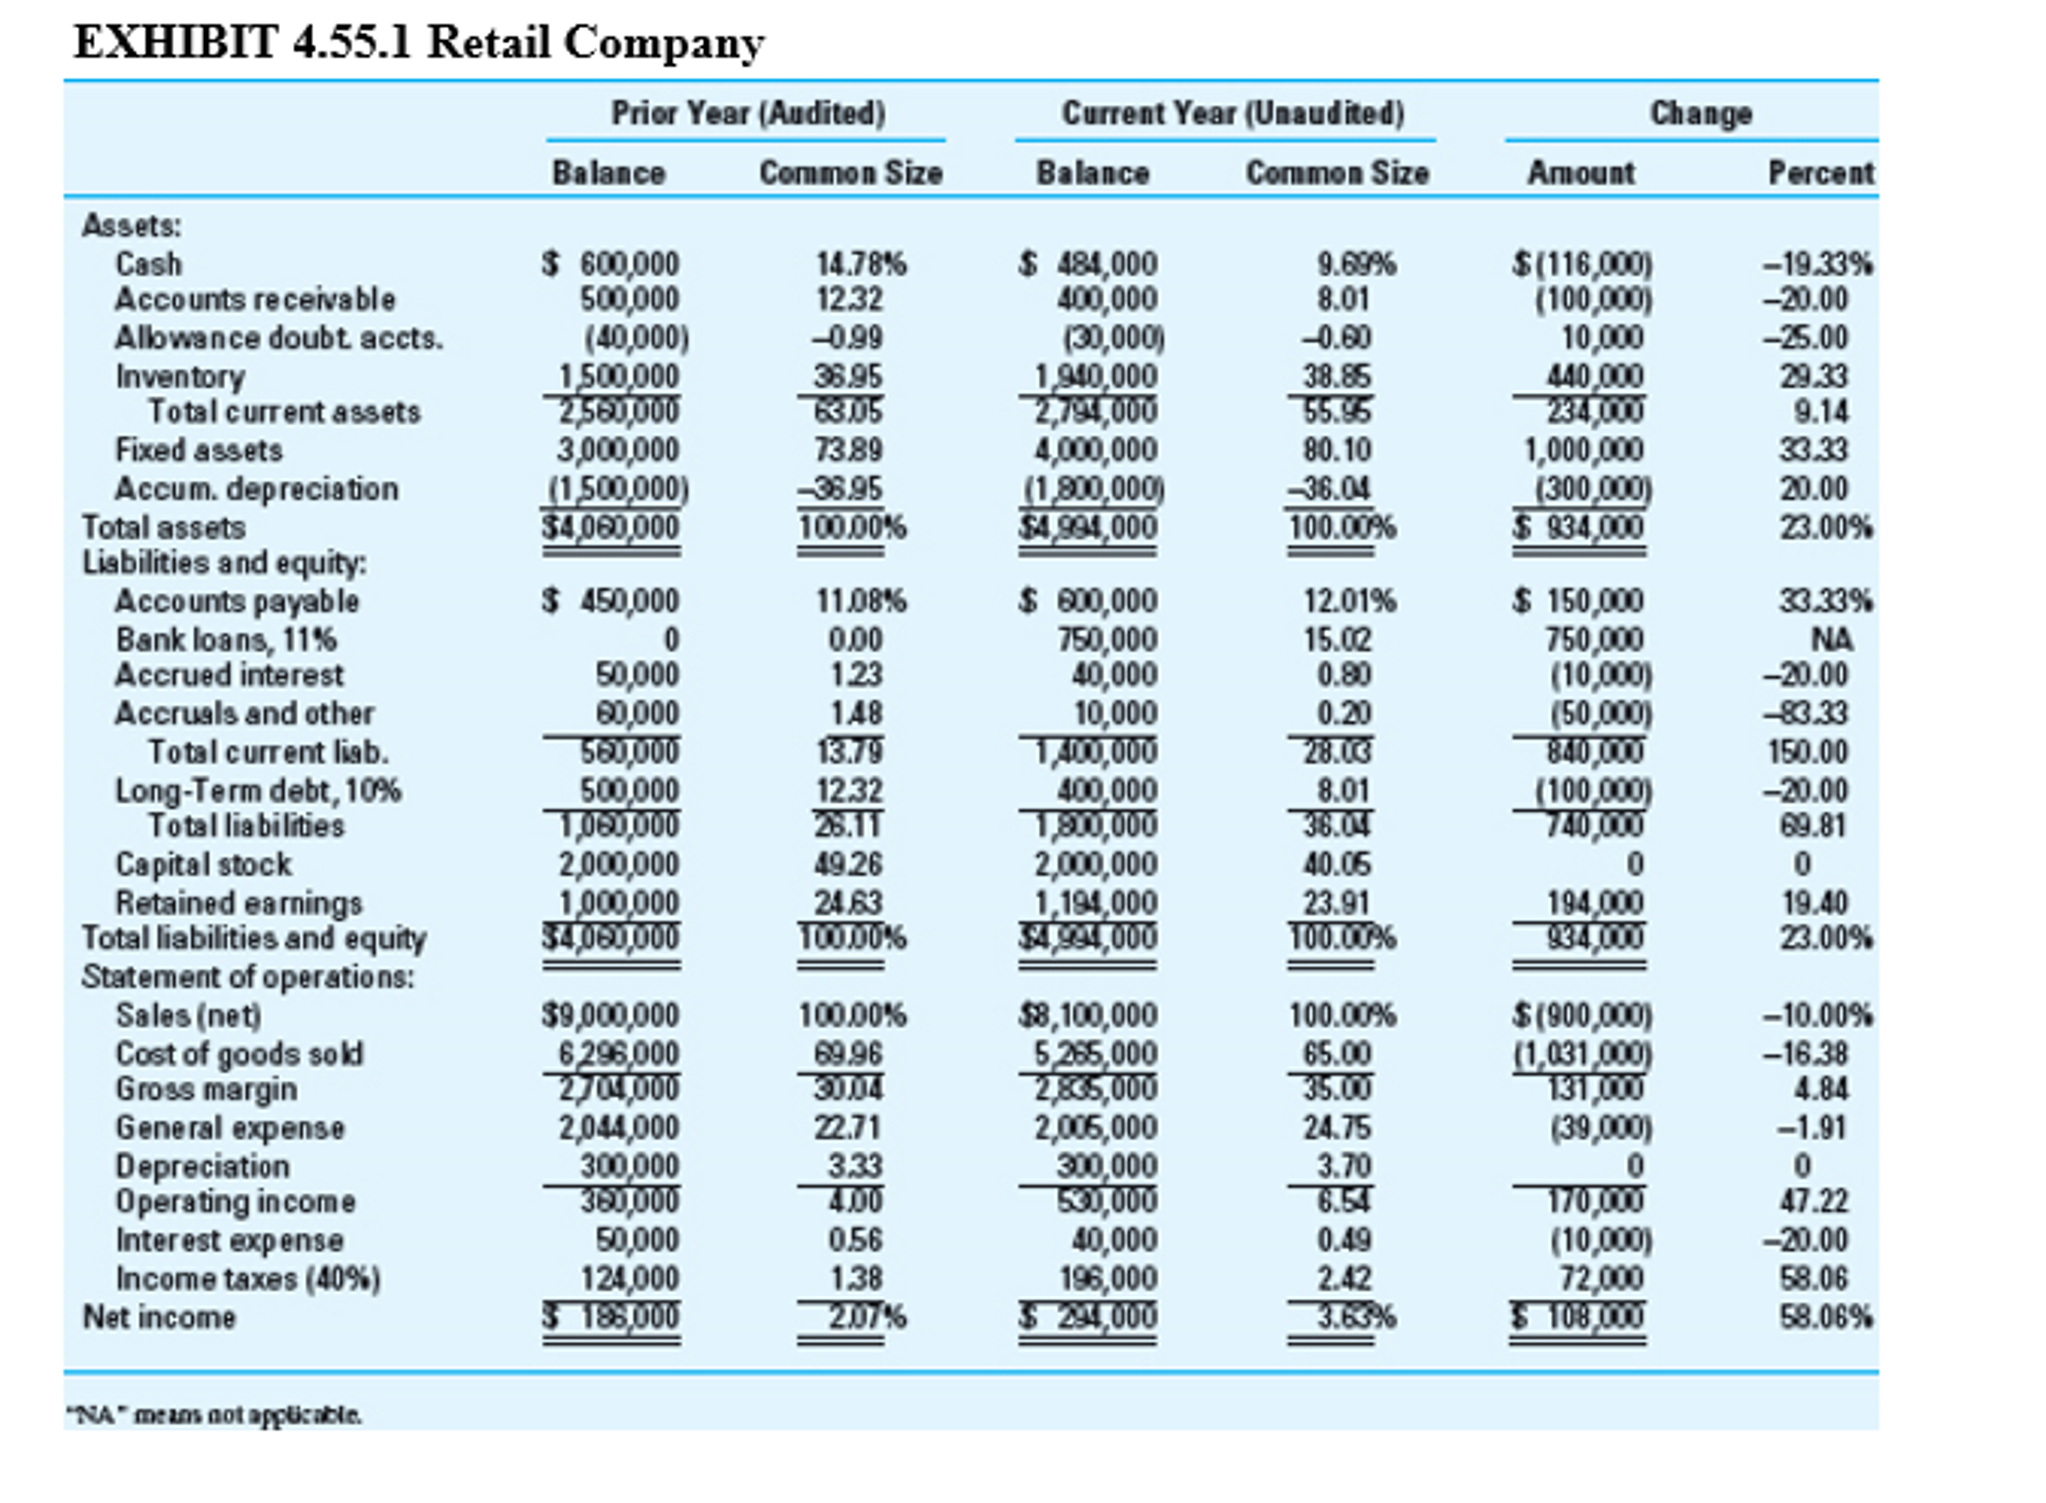
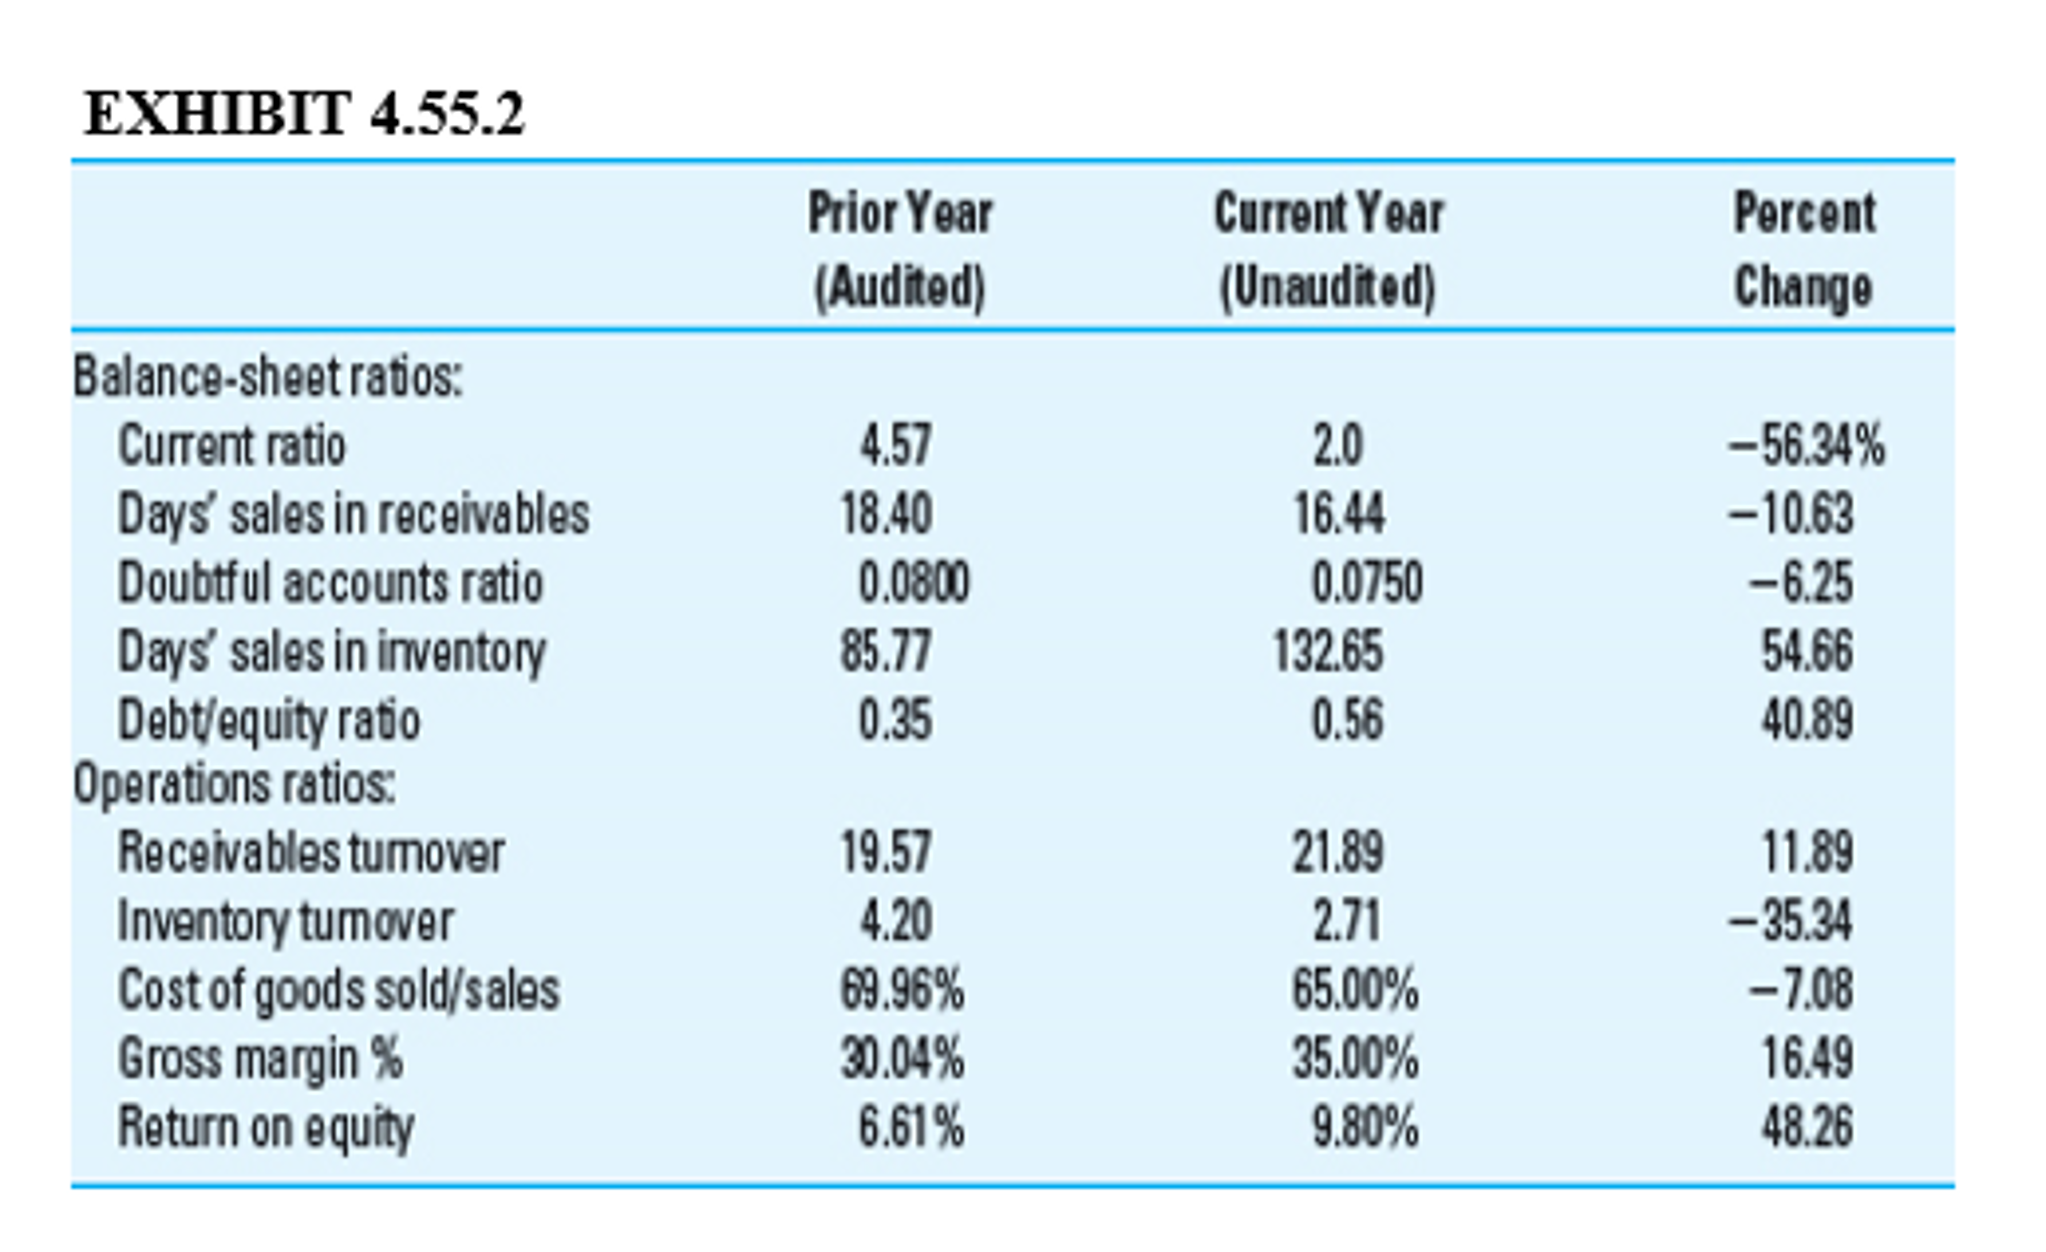
Horizontal analysis refers to changes of financial statement numbers and ratios across two or more years. Vertical analysis refers to financial statement amounts expressed each year as proportions of a base such as sales for the income-statement accounts and total assets for the balance-sheet accounts. Exhibit 4.55.1 contains Retail Company's prior-year (audited) and current-year (unaudited) financial statements, along with amounts and percentages of change from year to year (horizontal analysis) and common-size percentages (vertical analysis). Exhibit 4.55.2 contains selected financial ratios based on these financial statements. Analysis of these data can enable auditors to discern relationships that raise questions about misleading financial statements. Required: Study the data in Exhibits 4.55.1 and 4.55.2. Write a memorandum identifying and explaining potential problem areas where misstatements in the current-year financial statements could exist. Additional information about Retail Company is as follows:
The new bank loan, obtained on July 1 of the current year, requires maintenance of a 2:1 current ratio.
Principal of $100,000 plus interest on the 10 percent long-term note obtained several years ago in the original amount of $800,000 is due each January 1.
The company has never paid dividends on its common stock and has no plans for a dividend.
Step by Step Solution
There are 3 Steps involved in it
Step: 1

Get Instant Access to Expert-Tailored Solutions
See step-by-step solutions with expert insights and AI powered tools for academic success
Step: 2

Step: 3
Ace Your Homework with AI
Get the answers you need in no time with our AI-driven, step-by-step assistance
Get Started
My Adventures As An Auditor
Authors: Michael Quoter
1st Edition
1079508821, 978-1079508826