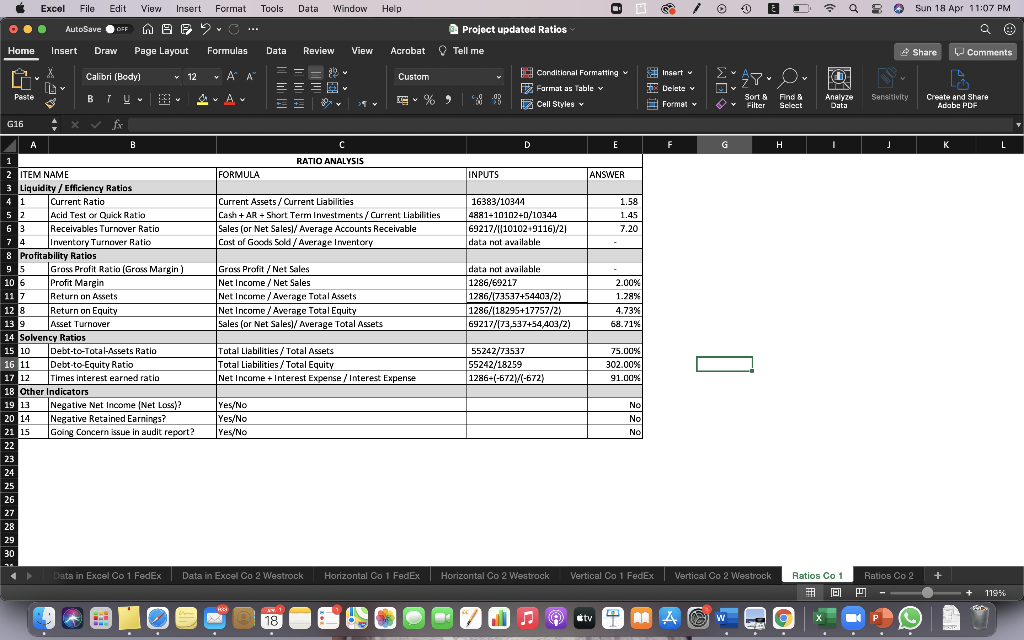
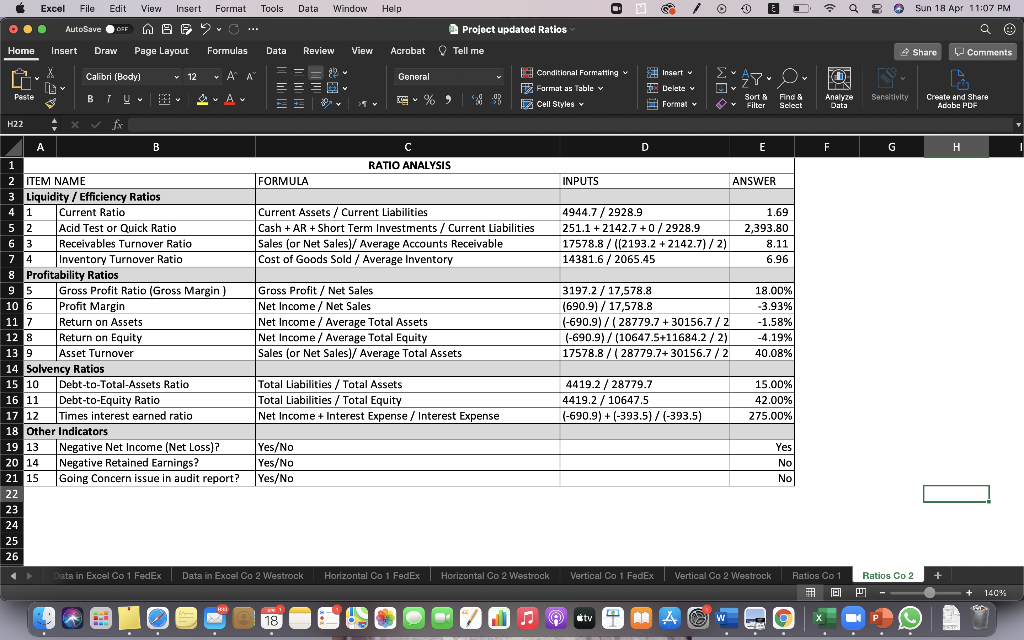
- Horizontal and Vertical: What are the trends you observe? Does one company seem stronger than the other based on these analyses?


Excel File Edit View Insert Format Tools Data Window Help Sun 18 Apr 11:07 PM AutoSave OSF 2 Project updated Ratios Home Insert Draw Page Layout Formulas Data Review View Acrobat Tell me A Share Comments ab Calibri (Body) v 12 APM Insert Y Custom Conditional Formatting Format as Table Cell Styles D. = = = Paste % 773 Delete Format Sort Filter Find & Select Analyze Data Sensitivity Create and Share Adobe PDF G16 fx A B D E F . J K L RATIO ANALYSIS FORMULA INPUTS ANSWER Current Assets / Ourrent Liabilities Cash + AR - Short Term Investments / Current Liabilities Sales (or Net Sales/ Average Accounts Receivable Cost of Goods Sold / Average Inventory 16383/10344 4881-10102+0/10344 69217/([1010249116)/21 data not available 1.58 1.45 7.20 Gross Profit/Net Sales Net Income / Net Sales Net Income / Average Total Assets Net Income / Average Total Equity Sales (or Net Sales)/ Average Total Assets data not available 1286/69217 1286/173537+54403/2) 1286/(18295+17757/2) 69217/73,537454,403/2) 2.00% 1.28% 4.73% 68.71% 1 2 ITEM NAME 3 Liquidity / Efficiency Ratios 4 1 Current Ratio 5 2 Acid Test or Quick Ratio 6 3 Receivables Turnover Ratio 74 Inventory Turnover Ratio 8 Profitability Ratios 9 5 Gross Profit Ratio (Gross Margin) 10 6 6 Profit Margin 11 7 Return on Assets 128 Return on Equity 13 9 Asset Turnover 14 Solvency Ratios 15 10 Debt-to-Total-Assets Ratio 16 11 Debt-to-Equity Ratio 17 12 Times interest earned ratio 18 Other Indicators 19 13 Negative Net Income Net Loss)? 20 14 Nerative Retained Earnings? 21 15 Going Concern issue in audit report? 22 23 24 25 26 27 28 29 30 Total Liabilities/Total Assets Total Liabilities/Total Equity Net Income + Interest Expense / Interest Expense 55242/73537 55242/18259 1286-(-6727/(-672) 75.00% 302.00% 91.00% Yes/No Yes/No Yes/No No No Nol Data in Excel Co 1 FedEx Data in Excel Co 2 Westrock 2 Horizontal Co 1 FedEx Horizontal Co 2 Westrock Vertical Co 1 FedEx Vertical Co 2 Westrock Ratios Co2 + Ratios Co 1 D + 119% SYE 18 ctv w Excel File Edit View Insert Format Tools Data Window Help Sun 18 Apr 11:07 PM . AutoSave OSF Project updated Ratios Home Insert Draw Page Layout Formulas Data Review View Acrobat Tell me Share V Comments Calibri (Body) al v 12 12 VA AP General Insert Y 0 Conditional Formatting F Format as Table v Cell Styles 27. O Paste TU 773 Delete Format v Prv % > 5 Sort Filter Find & Select Analyze Data Sensitivity Create and Share Adobe PDF H22 fix D E F G INPUTS ANSWER 4944.7 / 2928.9 251.1 +2142.7 +0/2928.9 17578.8 / ((2193.2 +2142.7)/2) 14381.6 / 2065.45 1.69 2,393.80 8.11 6.96 3197.2 / 17,578.8 (690.9)/17,578.8 (-690.9)/(28779.7 +30156.7/2 (-690.9)/(10647.5+11684.2 / 2) 17578.8 / (28779.7+30156.7 / 2 18.00% -3.93% -1.58% -4.19% 40.08% A B C 1 RATIO ANALYSIS 2 ITEM NAME FORMULA 3 Liquidity / Efficiency Ratios 4 1 Current Ratio Current Assets / Current Liabilities 5 2 Acid Test or Quick Ratio Cash + AR + Short Term Investments / Current Liabilities 6 3 Receivables Turnover Ratio Sales (or Net Sales)/ Average Accounts Receivable 7 4 4 Inventory Turnover Ratio Cost of Goods Sold / Average Inventory 8 Profitability Ratios 9 5 Gross Profit Ratio (Gross Margin) Gross Profit / Net Sales 10 6 Profit Margin Net Income / Net Sales 11 7 Return on Assets Net Income / Average Total Assets 12 12 8 Return on Equity Net Income / Average Total Equity 13 9 Asset Turnover Sales (or Net Sales)/ Average Total Assets 14 Solvency Ratios 15 10 Debt-to-Total-Assets Ratio Total Liabilities / Total Assets 12 16 11 1 Debt-to-Equity Ratio Total Liabilities / Total Equity 17 12 Times interest earned ratio Net Income + Interest Expense / Interest Expense 18 Other Indicators 19 13 Negative Net Income (Net Loss)? Yes/No 20 14 Negative Retained Earnings? Yes/No 21 15 Going Concern issue in audit report? Yes/No 22 23 24 25 26 Data in Excel Co 1 FedEx Data in Excel Co 2 Westrock Horizontal Co 1 FedEx Horizontal Co 2 Westrock 4419.2 / 28779.7 4419.2 / 10647.5 (-690.9) + (-393.5)/(-393.5) 15.00% 42.00% 275.00% Yes No No O Ratios Co2 + Vertical Co 1 FedEx Vertical Co 2 Westrock Ratios Co 1 1 DI + 140% SUE 1 18 ctv W


