 how and from where you calculate Finished goods inventory at the begining and finished goods inventory at the end , and why there is no Work in process inventory ?
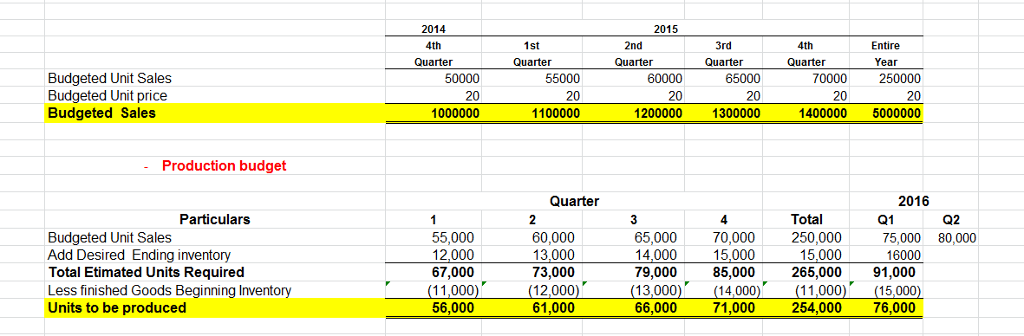
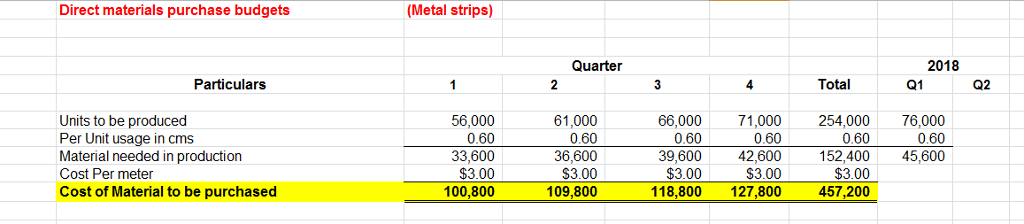
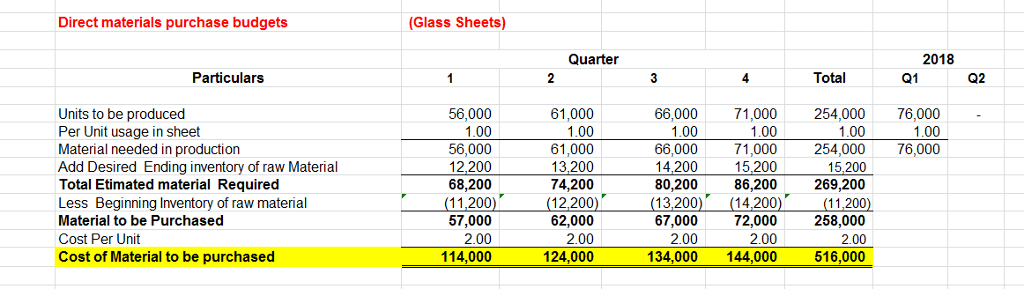
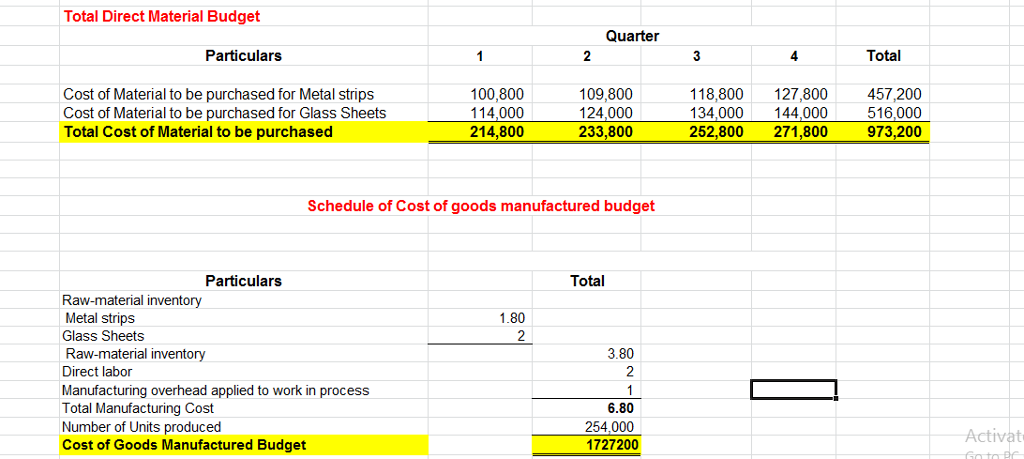
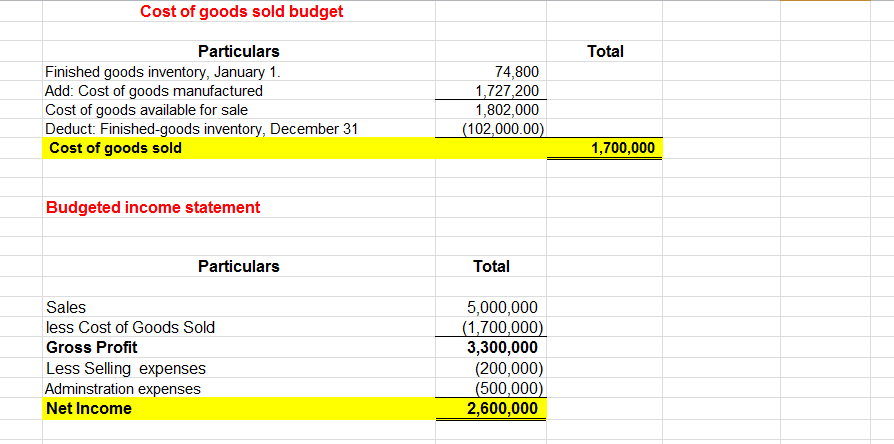
2014 4th Quarter 2015 1st Quarter 2nd Quarter 3rd Quarter 4th Quarter Entire Year Budgeted Unit Sales Budgeted Unit price Budgeted Sales 50000 20 1000000 55000 20 1100000 65000 0000 250000 20 1400000 5000000 20 1200000 1300000 - Production budget Quarter 2016 Q1 Total 250,000 Particulars Q2 Budgeted Unit Sales Add Desired Ending inventory Total Etimated Units Required Less finished Goods Beginning Invento Units to be produced 55,000 12,000 67,000 11,000 56,000 60,000 13,000 73,000 12,000) 61,000 65,000 70,000 14,000 79,000 13,000 66,000 75,000 80,000 15,000 85,000 14,000 71,000 15,000 16000 91,000 265,000 (11,000 254,000 76,000 Direct materials purchase budgets (Metal strips) Quarter 2018 Q1 Particulars 4 Total Q2 Units to be produced Per Unit usage in cms Material needed in production Cost Per meter Cost of Material to be purchased 56,000 0.60 33,600 $3.00 100,800 61,000 66,000 0,60 71,000 254,000 76.000 0.60 36,600 S3.00 109,800 0.60 39,600 42,600 $3.00 118,800 127,800 060 0.60 152,400 45,600 $3.00 $3.00 457,200 Direct materials purchase budgets (Glass Sheets) 2018 Q1 Quarter Particulars Total Q2 Units to be produced Per Unit usage in sheet Material needed in production Add Desired Ending inventory of raw Material Total Etimated material Required Less Beginning Inventory of raw material Material to be Purchased Cost Per Unit Cost of Material to be purchased 56,000 1.00 56,000 12,200 68,200 11,200) 57,000 2.00 114,000 61,000 1.00 61,000 13,200 74,200 12,200 62,000 2.00 124,000 66,000 71,000 254,00076,00 1.00 14,200 13,200) 2.00 1.00 15,200 (14.200 1.00 000254,000 76,000 1.00 66,00071, 15,200 80,200 86,200 269,200 11,200 67,000 72,000 258,000 2.00 516,000 2.00 134,000 144,000 Total Direct Material Budget Quarter Particulars 3 4 Total Cost of Material to be purchased for Metal strips Cost of Material to be purchased for Glass Sheets Total Cost of Material to be purchased 100,800 114,000 214,800 109,800 124,000 233,800 118,800 127,800 457,200 134,000 144,000 252,800 271,800 516,000 973,200 Schedule of Cost of goods manufactured budget Particulars Total Raw-material inventory Metal strips Glass Sheets Raw-material inventory Direct labor Manufacturing overhead applied to work in process Total Manufacturing Cost Number of Units produced Cost of Goods Manufactured Budget 1.80 3.80 2 6.80 254,000 1727200 ctivat Cost of goods sold budget Particulars Total Finished goods inventory, January 1 Add: Cost of goods manufactured Cost of goods available for sale Deduct: Finished-goods inventory, December 31 Cost of goods sold 74,800 1,727,200 1,802,000 102,000.00 1,700,000 Budgeted income statement Particulars Total Sales less Cost of Goods Sold Gross Profit Less Selling expenses Adminstration expenses Net Income 5,000,000 (1700,000) 3,300,000 (200,000) 500,000 2,600,000 2014 4th Quarter 2015 1st Quarter 2nd Quarter 3rd Quarter 4th Quarter Entire Year Budgeted Unit Sales Budgeted Unit price Budgeted Sales 50000 20 1000000 55000 20 1100000 65000 0000 250000 20 1400000 5000000 20 1200000 1300000 - Production budget Quarter 2016 Q1 Total 250,000 Particulars Q2 Budgeted Unit Sales Add Desired Ending inventory Total Etimated Units Required Less finished Goods Beginning Invento Units to be produced 55,000 12,000 67,000 11,000 56,000 60,000 13,000 73,000 12,000) 61,000 65,000 70,000 14,000 79,000 13,000 66,000 75,000 80,000 15,000 85,000 14,000 71,000 15,000 16000 91,000 265,000 (11,000 254,000 76,000 Direct materials purchase budgets (Metal strips) Quarter 2018 Q1 Particulars 4 Total Q2 Units to be produced Per Unit usage in cms Material needed in production Cost Per meter Cost of Material to be purchased 56,000 0.60 33,600 $3.00 100,800 61,000 66,000 0,60 71,000 254,000 76.000 0.60 36,600 S3.00 109,800 0.60 39,600 42,600 $3.00 118,800 127,800 060 0.60 152,400 45,600 $3.00 $3.00 457,200 Direct materials purchase budgets (Glass Sheets) 2018 Q1 Quarter Particulars Total Q2 Units to be produced Per Unit usage in sheet Material needed in production Add Desired Ending inventory of raw Material Total Etimated material Required Less Beginning Inventory of raw material Material to be Purchased Cost Per Unit Cost of Material to be purchased 56,000 1.00 56,000 12,200 68,200 11,200) 57,000 2.00 114,000 61,000 1.00 61,000 13,200 74,200 12,200 62,000 2.00 124,000 66,000 71,000 254,00076,00 1.00 14,200 13,200) 2.00 1.00 15,200 (14.200 1.00 000254,000 76,000 1.00 66,00071, 15,200 80,200 86,200 269,200 11,200 67,000 72,000 258,000 2.00 516,000 2.00 134,000 144,000 Total Direct Material Budget Quarter Particulars 3 4 Total Cost of Material to be purchased for Metal strips Cost of Material to be purchased for Glass Sheets Total Cost of Material to be purchased 100,800 114,000 214,800 109,800 124,000 233,800 118,800 127,800 457,200 134,000 144,000 252,800 271,800 516,000 973,200 Schedule of Cost of goods manufactured budget Particulars Total Raw-material inventory Metal strips Glass Sheets Raw-material inventory Direct labor Manufacturing overhead applied to work in process Total Manufacturing Cost Number of Units produced Cost of Goods Manufactured Budget 1.80 3.80 2 6.80 254,000 1727200 ctivat Cost of goods sold budget Particulars Total Finished goods inventory, January 1 Add: Cost of goods manufactured Cost of goods available for sale Deduct: Finished-goods inventory, December 31 Cost of goods sold 74,800 1,727,200 1,802,000 102,000.00 1,700,000 Budgeted income statement Particulars Total Sales less Cost of Goods Sold Gross Profit Less Selling expenses Adminstration expenses Net Income 5,000,000 (1700,000) 3,300,000 (200,000) 500,000 2,600,000