

Question: How can differential analysis be applied here to determine if it would be profitable to invest in new equipment to increase capacity for a constrained
- How can differential analysis be applied here to determine if it would be profitable to invest in new equipment to
 increase capacity for a constrained resource?
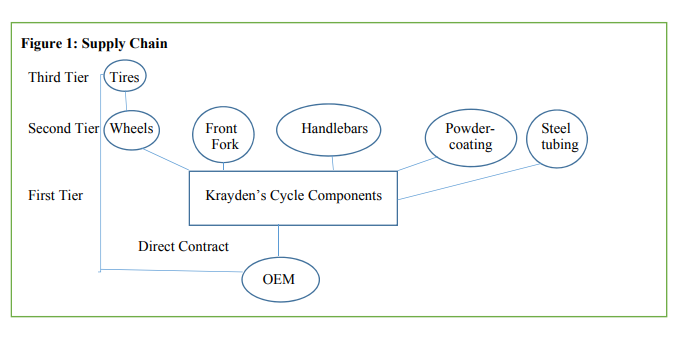
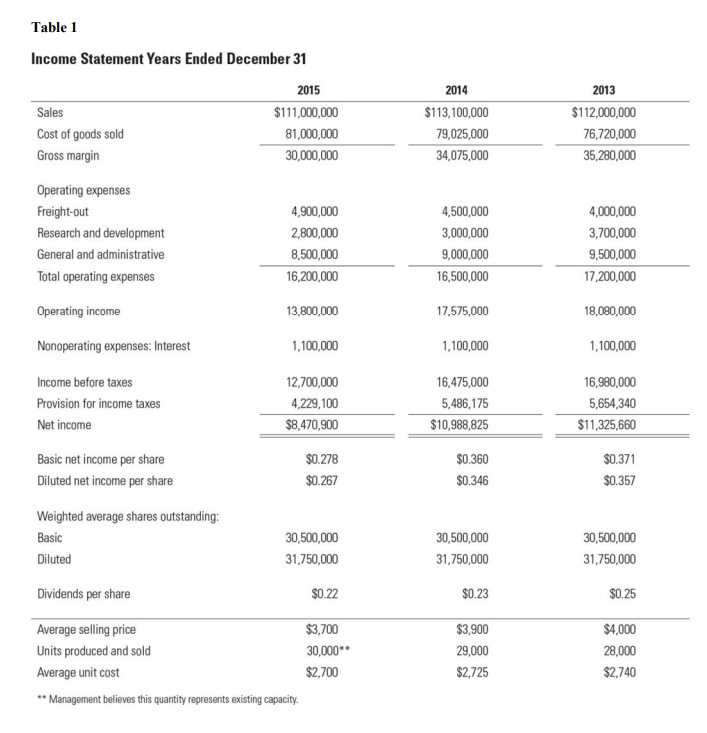
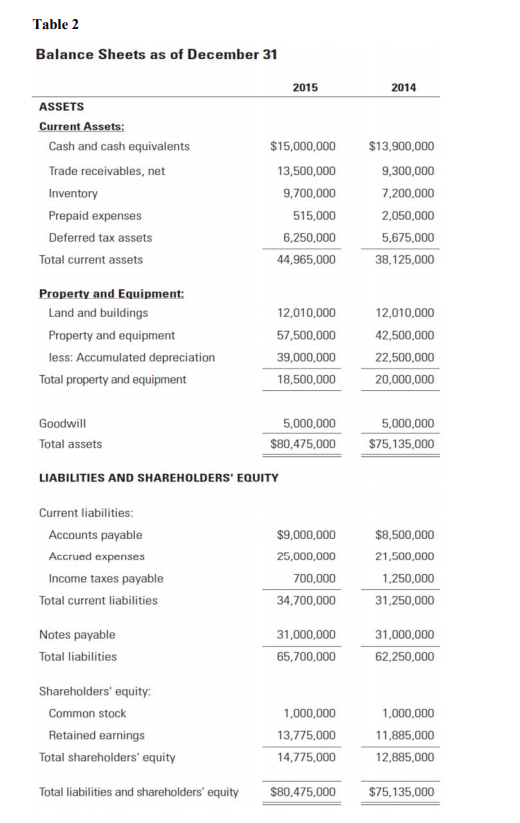
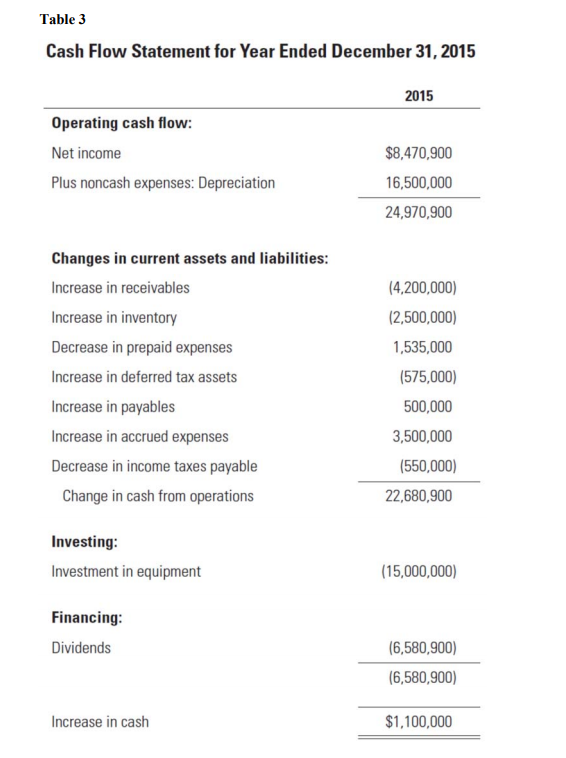
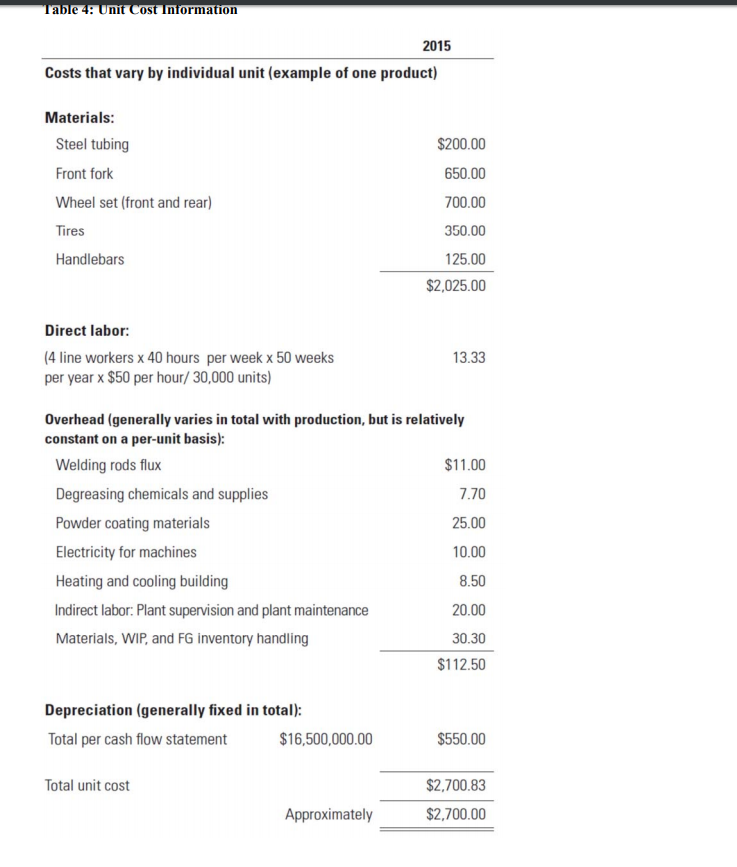
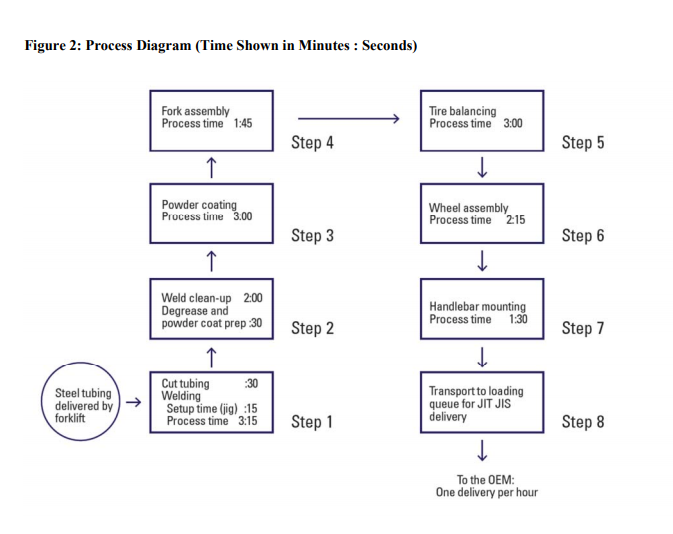
Krayden's Cycle Components (KCC) is a high-end specialty fabricator that manufactures one product with many variants. The basic product is known as a rolling chassis, a key component used in manufacturing motorcycles. While there are variations across the industry, a rolling chassis typically consists of a motorcycle frame, front forks, wheels and tires, and handlebars. KCC is a first-tier supplier to an original equipment manufacturer (OEM) that produces motorcycles in three versions Sport, Cruising, and Retro. The OEM purchases KCC product and attaches its well-known proprietary engine and gearbox, wiring and gauges, seat, fenders, various components, and gas tank with iconic emblem. The OEM is KCC's sole customer as it essentially requires KCC's full capacity KCC manufactures each frame from steel tubing but purchases a variety of parts from suppliers. Workers at KCC attach these parts to the frame to complete the rolling chassis. Figure 1 illustrates the supply chain. The suppliers of wheels, front forks, and handlebars are second-tier suppliers. These vendors provide parts that are ready to be attached to the frame. The tire vendor is considered a third-tier supplier. The company that builds the wheels acquires tires (that meet contract specifications directly negotiated by the OEM) and provides a complete wheel assembly ready to be attached to the front fork and rear frame KCC has had numerous problems with delivery and quality over the past several years. Because the problems have been so acute, the company has employed four different plant mana supply chain has difficulties; unfortunately, there is virtually no room for error in meeting delivery schedules and product quality targets. Further, KCC has been under increased scrutiny from its stockholders because earnings have deteriorated over the past three years. See Tables 1-4 for KCC's financial information (income statement, balance sheet, statement of cash flows, and unit cost information) gers in the last five years. Management acknowledges the The economic recession that ended around the summer of 2009 has enabled the OEM to expand production and sales. The company's sales have increased by 1,000 units per year since 2010. By 2015, KCC was delivering 30,000 units to the OEM; management believes this level of output represents capacity. Thus, production above 30,000 units is not possible without staff overtime or an investment in additional plant resources that wl increase hourly throughput. Management at KCC has received notice that the OEM plans to increase production by 3,750 units next year (12.5%) and to demand price concessions of $200 per unit as specified in the contract. THE PRODUCT MIX AND OUTSOURCED PARTS The OEM produces motorcycles for three different market niches; therefore, KCC produces three distinctly different frame geometries as follows Sport bikes emphasize speed and agility. Customers expect rapid acceleration and responsive handling. Cruising bikes emphasize power and comfort. They allow riders to enjoy long-distance touring Retro bikes appeal to customers who appreciate classic designs. They are typically smaller than cruising bikes and more stable than sport bikes. For each frame geometry, the OEM offers three possible handlebar types. Because riders are various sizes, handlebars can be configured in a variety of heights, widths, and lengths (straight bars or bars pulled back toward the rider) The OEM offers three different wheel set possibilities. Wheel sets consist of one front wheel and one rear wheel. The different wheel designs are Chrome spokes. Cast aluminum polished (silver) alloy wheels. Cast aluminum anodized (black) alloy wheels. The OEM offers four unique tire choices for each frame type. Thus, KCC could purchase as many as 12 different tire models to meet market demand (three frame types x four different tires per frame). Factors that differentiate the tires nclude Bias-ply (characterized by a round profile and tall sidewalls) Radial (characterized by a flat profile and short sidewalls) Grip (soft-better road grip but shorter tread life; hard-poorer road grip, but longer tread life) Tread design (differences in the number of grooves in the tire pattern). Number of layers (known as plies) from which the tire is constructed; using more layers results in a stiffer tire The OEM contracts directly with the tire manufacturer to supply specific tires to the wheel manufacturer. Much engineering effort has gone into identifying the proper tires and wheels for each type of motorcycle. The wheel vendor receives and mounts the appropriate tire on the wheel set and then delivers the set to KCC. The tire manufacturer sells its products to different OEMs, as well as to aftermarket customers. Recently, the OEM has complained to KCC about chassis that vibrate and exhibit poo completed motorcycle is test driven. Engineers at KCC have traced the source of the problem to the tire manufacturer. A wheel/tire combination that is not balanced properly causes vibration and is a control and safety issue. The solution requires placing the wheel/tire set on a machine to determine the location of the imperfection causing the imbalance. A small weight is attached to the wheel to offset the tire imperfection and to remove the vibration. Because of pressure from the OEM to deliver a quality chassis, KCC purchased a wheel balancing machine and tested each set before installing it on their chassis. The quality delivered to the OEM has improved, but management at KCC is unhappy because the OEM refuses to increase the contract price to help offset KCC's additional cost of equipment and labor r handling qualities when the The supply chain has additional complications. One of KCC's suppliers (a second-tier supplier that produces handlebars) is also a subsidiary of the holding company that owns KCC. This supplier has contracts with manufacturers of bicycles, scooters, and power chairs. On several occasions, this supplier has missed scheduled deliveries. When confronted, management explained they had external customers whose orders must be filled. At certain times of the year, demand exceeds the supplier's ability to meet it. As a result, KCC management has scrambled to find suitable suppliers (at much greater cost) in order to meet their own delivery schedules. PROCESS DESCRIPTION KCC receives an order from the OEM exactly three hours before the specific chassis is needed on the OEM's assembly line. The company employs four production line workers who are cross-trained to perform multiple functions. Figure 2 illustrates the manufacturing process for KCC, a manufacturing cell that includes the following processes Step 1. Tube cutting and assembly. Steel tubes arrive by forklift at Step 1, the cutting and welding process Cutting. Using a computer numerically controlled (CNC) machine, steel tubes are bent and cut to proper angles and lengths that match the engineering design specifications for each frame typeSport, Cruising, or Retro Welding. After the tubes are cut, they are clamped to a jig that holds them stationary at the proper angle for welding. A robot tack-welds each joint, which is a temporary weld to hold the assembly in preparation for final welding. Once the frame is completely assembled by tack welds, the robot permanently welds the joints Step 2. Weld cleanup and preparation. The welded metal frame advances to the next process where the welds are smoothed and polished, then to a cleaning bath where the frame is cleansed of oils and surface contamination prior to the powder coating process. Step 3. Powder coating. KCC powder coats, rather than paints, the frames. Consistent with environmental sustainability issues, the powder coating process emits almost zero volatile organic compounds (VOCs). In addition, any overspray can be captured and reused. Powder coating is a dry powder that does not require a solvent. The powder coating is robotically sprayed within a booth by a nozzle that imparts a negative electrical charge to the powder. The powder electrostatically adheres to the grounded frame. The frame is heated to approximately 400 degrees Fahrenheit for around three minutes to melt the powder that flows to produce a smooth, strong, glossy finish. Figure 1: Supply Chain Third Tier Tires Second TierWheels Front Fork Powder- coating Steel tubing Handlebars list TeT ler Krayden's Cycle Components Direct Contract OEM Table 1 Income Statement Years Ended December 31 2015 $111,000,000 81,000,000 30,000,00 2014 2013 Sales Cost of goods sold Gross margin $113,100,000 79,025,000 4,075,000 $112,000,000 76,720,000 35,280,000 Operating expenses Freight-out Research and development General and administrative Total operating expenses 4,900,000 2,800,000 8,500,000 16,200,000 ,500,000 3,000,000 9,000,000 16,500,000 4,000,000 3,700,000 9,500,000 17,200,000 Operating income 13,800,000 17,575,000 18,080,000 Nonoperating expenses: Interest 1,100,000 1,100,000 1,100,000 ncome before taxes Provision fo income taxes Net income 12,700,000 ,229,100 8,470,900 16,475,000 5,486,175 $10,988,825 16,980,000 5,654,340 910:300,029$11,325,660 0.371 0.357 Basic net income per share Diluted net income per share $0.278 0.267 0.360 0.346 Weighted average shares outstanding: Basic Diluted 30,500,000 31,750,000 30,500,000 30,500,000 31,750,000 31,750,000 Dividends per share 0.22 $0.23 0.25 Average selling price Units produced and sold Average unit cost $3,700 30,000 $2,700 $3,900 29,000 $2,725 $4,000 28,000 $2,740 Management believes this quantity represents existing capacity. Table 2 Balance Sheets as of December 31 2015 2014 ASSETS Current Assets: Cash and cash equivalents Trade receivables, net Inventory Prepaid expenses Deferred tax assets $15,000,000 13,500,000 9,700,000 515,000 6,250,000 44,965,000 $13,900,000 9,300,000 7.200,000 2,050,000 5,675,000 38,125,000 Total current assets Property and Equipment: Land and buildings Property and equipment less: Accumulated depreciation 12,010,000 57,500,000 39,000,000 18,500,000 12,010,000 2,500,000 22,500,000 20,000,000 Total property and equipment Goodwill Total assets 5,000,000 5,000,000 $80,475,000 75.135,000 LIABILITIES AND SHAREHOLDERS' EQUITY Current liabilities Accounts payable Accrued expenses Income taxes payable $9,000,000 25,000,000 700,000 34,700,000 $8,500,000 21,500,000 1,250,000 31,250,000 Total current liabilities Notes payable 31,000,000 31,000,000 Total liabilities 65,700,000 62,250,000 Shareholders' equity: Common stock 1,000,000 13,775,000 14,775,000 1,000,000 11,885,000 12,885,000 Retained earnings Total shareholders' equity Total liabilities and shareholders' equity$80,475,000 $75,135,000 Table 3 Cash Flow Statement for Year Ended December 31, 2015 2015 Operating cash flow: Net income Plus noncash expenses: Depreciation $8,470,900 16,500,000 24,970,900 Changes in current assets and liabilities Increase in receivables Increase in inventory Decrease in prepaid expenses Increase in deferred tax assets Increase in payables Increase in accrued expenses Decrease in income taxes payable 4,200,000) (2,500,000) 1,535,000 (575,000) 500,000 3,500,000 (550,000) 22,680,900 Change in cash from operations Investing Investment in equipment (15,000,000) Financing Dividends (6,580,900) (6,580,900) $1,100,000 Increase in cash nit Cost Information 2015 Costs that vary by individual unit (example of one product) Materials Steel tubing Front fork Wheel set (front and rear) Tires Handlebars $200.00 650.00 700.00 350.00 125.00 2,025.00 Direct labor 13.33 4 line workers x 40 hours per week x 50 weeks per year x $50 per hour/30,000 units) Overhead (generally varies in total with production, but is relatively constant on a per-unit basis): Welding rods flux Degreasing chemicals and supplies Powder coating materials Electricity for machines Heating and cooling building Indirect labor: Plant supervision and plant maintenance Materials, WIP, and FG inventory handling $11.00 7.70 25.00 10.00 8.50 20.00 30.30 $112.50 Depreciation (generally fixed in total): Total per cash flow statement $16,500,000.00 $550.00 Total unit cost $2,700.83 Approximately $2,700.00 Figure 2: Process Diagram (Time Shown in Minutes : Seconds) Fork assembly Process time 1:45 Tire balancing Process time 3:00 Step 4 Step 5 Powder coating Process time 3.00 Wheel assembly Process time 215 Step 3 Step 6 Weld clean-up 2:00 Degrease and powder coat prep Step 2 Handlebar mounting Process time 1:30 Step 7 Cut tubing Welding Setup time (ig) 15 Process time 3:15Step 1 30 Steel tubing delivered by forklift Transport to loading queue for JIT JIS delivery Step 8 To the OEM One delivery per hour Krayden's Cycle Components (KCC) is a high-end specialty fabricator that manufactures one product with many variants. The basic product is known as a rolling chassis, a key component used in manufacturing motorcycles. While there are variations across the industry, a rolling chassis typically consists of a motorcycle frame, front forks, wheels and tires, and handlebars. KCC is a first-tier supplier to an original equipment manufacturer (OEM) that produces motorcycles in three versions Sport, Cruising, and Retro. The OEM purchases KCC product and attaches its well-known proprietary engine and gearbox, wiring and gauges, seat, fenders, various components, and gas tank with iconic emblem. The OEM is KCC's sole customer as it essentially requires KCC's full capacity KCC manufactures each frame from steel tubing but purchases a variety of parts from suppliers. Workers at KCC attach these parts to the frame to complete the rolling chassis. Figure 1 illustrates the supply chain. The suppliers of wheels, front forks, and handlebars are second-tier suppliers. These vendors provide parts that are ready to be attached to the frame. The tire vendor is considered a third-tier supplier. The company that builds the wheels acquires tires (that meet contract specifications directly negotiated by the OEM) and provides a complete wheel assembly ready to be attached to the front fork and rear frame KCC has had numerous problems with delivery and quality over the past several years. Because the problems have been so acute, the company has employed four different plant mana supply chain has difficulties; unfortunately, there is virtually no room for error in meeting delivery schedules and product quality targets. Further, KCC has been under increased scrutiny from its stockholders because earnings have deteriorated over the past three years. See Tables 1-4 for KCC's financial information (income statement, balance sheet, statement of cash flows, and unit cost information) gers in the last five years. Management acknowledges the The economic recession that ended around the summer of 2009 has enabled the OEM to expand production and sales. The company's sales have increased by 1,000 units per year since 2010. By 2015, KCC was delivering 30,000 units to the OEM; management believes this level of output represents capacity. Thus, production above 30,000 units is not possible without staff overtime or an investment in additional plant resources that wl increase hourly throughput. Management at KCC has received notice that the OEM plans to increase production by 3,750 units next year (12.5%) and to demand price concessions of $200 per unit as specified in the contract. THE PRODUCT MIX AND OUTSOURCED PARTS The OEM produces motorcycles for three different market niches; therefore, KCC produces three distinctly different frame geometries as follows Sport bikes emphasize speed and agility. Customers expect rapid acceleration and responsive handling. Cruising bikes emphasize power and comfort. They allow riders to enjoy long-distance touring Retro bikes appeal to customers who appreciate classic designs. They are typically smaller than cruising bikes and more stable than sport bikes. For each frame geometry, the OEM offers three possible handlebar types. Because riders are various sizes, handlebars can be configured in a variety of heights, widths, and lengths (straight bars or bars pulled back toward the rider) The OEM offers three different wheel set possibilities. Wheel sets consist of one front wheel and one rear wheel. The different wheel designs are Chrome spokes. Cast aluminum polished (silver) alloy wheels. Cast aluminum anodized (black) alloy wheels. The OEM offers four unique tire choices for each frame type. Thus, KCC could purchase as many as 12 different tire models to meet market demand (three frame types x four different tires per frame). Factors that differentiate the tires nclude Bias-ply (characterized by a round profile and tall sidewalls) Radial (characterized by a flat profile and short sidewalls) Grip (soft-better road grip but shorter tread life; hard-poorer road grip, but longer tread life) Tread design (differences in the number of grooves in the tire pattern). Number of layers (known as plies) from which the tire is constructed; using more layers results in a stiffer tire The OEM contracts directly with the tire manufacturer to supply specific tires to the wheel manufacturer. Much engineering effort has gone into identifying the proper tires and wheels for each type of motorcycle. The wheel vendor receives and mounts the appropriate tire on the wheel set and then delivers the set to KCC. The tire manufacturer sells its products to different OEMs, as well as to aftermarket customers. Recently, the OEM has complained to KCC about chassis that vibrate and exhibit poo completed motorcycle is test driven. Engineers at KCC have traced the source of the problem to the tire manufacturer. A wheel/tire combination that is not balanced properly causes vibration and is a control and safety issue. The solution requires placing the wheel/tire set on a machine to determine the location of the imperfection causing the imbalance. A small weight is attached to the wheel to offset the tire imperfection and to remove the vibration. Because of pressure from the OEM to deliver a quality chassis, KCC purchased a wheel balancing machine and tested each set before installing it on their chassis. The quality delivered to the OEM has improved, but management at KCC is unhappy because the OEM refuses to increase the contract price to help offset KCC's additional cost of equipment and labor r handling qualities when the The supply chain has additional complications. One of KCC's suppliers (a second-tier supplier that produces handlebars) is also a subsidiary of the holding company that owns KCC. This supplier has contracts with manufacturers of bicycles, scooters, and power chairs. On several occasions, this supplier has missed scheduled deliveries. When confronted, management explained they had external customers whose orders must be filled. At certain times of the year, demand exceeds the supplier's ability to meet it. As a result, KCC management has scrambled to find suitable suppliers (at much greater cost) in order to meet their own delivery schedules. PROCESS DESCRIPTION KCC receives an order from the OEM exactly three hours before the specific chassis is needed on the OEM's assembly line. The company employs four production line workers who are cross-trained to perform multiple functions. Figure 2 illustrates the manufacturing process for KCC, a manufacturing cell that includes the following processes Step 1. Tube cutting and assembly. Steel tubes arrive by forklift at Step 1, the cutting and welding process Cutting. Using a computer numerically controlled (CNC) machine, steel tubes are bent and cut to proper angles and lengths that match the engineering design specifications for each frame typeSport, Cruising, or Retro Welding. After the tubes are cut, they are clamped to a jig that holds them stationary at the proper angle for welding. A robot tack-welds each joint, which is a temporary weld to hold the assembly in preparation for final welding. Once the frame is completely assembled by tack welds, the robot permanently welds the joints Step 2. Weld cleanup and preparation. The welded metal frame advances to the next process where the welds are smoothed and polished, then to a cleaning bath where the frame is cleansed of oils and surface contamination prior to the powder coating process. Step 3. Powder coating. KCC powder coats, rather than paints, the frames. Consistent with environmental sustainability issues, the powder coating process emits almost zero volatile organic compounds (VOCs). In addition, any overspray can be captured and reused. Powder coating is a dry powder that does not require a solvent. The powder coating is robotically sprayed within a booth by a nozzle that imparts a negative electrical charge to the powder. The powder electrostatically adheres to the grounded frame. The frame is heated to approximately 400 degrees Fahrenheit for around three minutes to melt the powder that flows to produce a smooth, strong, glossy finish. Figure 1: Supply Chain Third Tier Tires Second TierWheels Front Fork Powder- coating Steel tubing Handlebars list TeT ler Krayden's Cycle Components Direct Contract OEM Table 1 Income Statement Years Ended December 31 2015 $111,000,000 81,000,000 30,000,00 2014 2013 Sales Cost of goods sold Gross margin $113,100,000 79,025,000 4,075,000 $112,000,000 76,720,000 35,280,000 Operating expenses Freight-out Research and development General and administrative Total operating expenses 4,900,000 2,800,000 8,500,000 16,200,000 ,500,000 3,000,000 9,000,000 16,500,000 4,000,000 3,700,000 9,500,000 17,200,000 Operating income 13,800,000 17,575,000 18,080,000 Nonoperating expenses: Interest 1,100,000 1,100,000 1,100,000 ncome before taxes Provision fo income taxes Net income 12,700,000 ,229,100 8,470,900 16,475,000 5,486,175 $10,988,825 16,980,000 5,654,340 910:300,029$11,325,660 0.371 0.357 Basic net income per share Diluted net income per share $0.278 0.267 0.360 0.346 Weighted average shares outstanding: Basic Diluted 30,500,000 31,750,000 30,500,000 30,500,000 31,750,000 31,750,000 Dividends per share 0.22 $0.23 0.25 Average selling price Units produced and sold Average unit cost $3,700 30,000 $2,700 $3,900 29,000 $2,725 $4,000 28,000 $2,740 Management believes this quantity represents existing capacity. Table 2 Balance Sheets as of December 31 2015 2014 ASSETS Current Assets: Cash and cash equivalents Trade receivables, net Inventory Prepaid expenses Deferred tax assets $15,000,000 13,500,000 9,700,000 515,000 6,250,000 44,965,000 $13,900,000 9,300,000 7.200,000 2,050,000 5,675,000 38,125,000 Total current assets Property and Equipment: Land and buildings Property and equipment less: Accumulated depreciation 12,010,000 57,500,000 39,000,000 18,500,000 12,010,000 2,500,000 22,500,000 20,000,000 Total property and equipment Goodwill Total assets 5,000,000 5,000,000 $80,475,000 75.135,000 LIABILITIES AND SHAREHOLDERS' EQUITY Current liabilities Accounts payable Accrued expenses Income taxes payable $9,000,000 25,000,000 700,000 34,700,000 $8,500,000 21,500,000 1,250,000 31,250,000 Total current liabilities Notes payable 31,000,000 31,000,000 Total liabilities 65,700,000 62,250,000 Shareholders' equity: Common stock 1,000,000 13,775,000 14,775,000 1,000,000 11,885,000 12,885,000 Retained earnings Total shareholders' equity Total liabilities and shareholders' equity$80,475,000 $75,135,000 Table 3 Cash Flow Statement for Year Ended December 31, 2015 2015 Operating cash flow: Net income Plus noncash expenses: Depreciation $8,470,900 16,500,000 24,970,900 Changes in current assets and liabilities Increase in receivables Increase in inventory Decrease in prepaid expenses Increase in deferred tax assets Increase in payables Increase in accrued expenses Decrease in income taxes payable 4,200,000) (2,500,000) 1,535,000 (575,000) 500,000 3,500,000 (550,000) 22,680,900 Change in cash from operations Investing Investment in equipment (15,000,000) Financing Dividends (6,580,900) (6,580,900) $1,100,000 Increase in cash nit Cost Information 2015 Costs that vary by individual unit (example of one product) Materials Steel tubing Front fork Wheel set (front and rear) Tires Handlebars $200.00 650.00 700.00 350.00 125.00 2,025.00 Direct labor 13.33 4 line workers x 40 hours per week x 50 weeks per year x $50 per hour/30,000 units) Overhead (generally varies in total with production, but is relatively constant on a per-unit basis): Welding rods flux Degreasing chemicals and supplies Powder coating materials Electricity for machines Heating and cooling building Indirect labor: Plant supervision and plant maintenance Materials, WIP, and FG inventory handling $11.00 7.70 25.00 10.00 8.50 20.00 30.30 $112.50 Depreciation (generally fixed in total): Total per cash flow statement $16,500,000.00 $550.00 Total unit cost $2,700.83 Approximately $2,700.00 Figure 2: Process Diagram (Time Shown in Minutes : Seconds) Fork assembly Process time 1:45 Tire balancing Process time 3:00 Step 4 Step 5 Powder coating Process time 3.00 Wheel assembly Process time 215 Step 3 Step 6 Weld clean-up 2:00 Degrease and powder coat prep Step 2 Handlebar mounting Process time 1:30 Step 7 Cut tubing Welding Setup time (ig) 15 Process time 3:15Step 1 30 Steel tubing delivered by forklift Transport to loading queue for JIT JIS delivery Step 8 To the OEM One delivery per hour
Step by Step Solution
There are 3 Steps involved in it

Get step-by-step solutions from verified subject matter experts