Answered step by step
Verified Expert Solution
Question
1 Approved Answer
How can I add my Exel Sheet?? 1. Gudrun Duplessis is a manager in the Alanis Parks Department. Gudrun is compiling spending data in preparation


How can I add my Exel Sheet??
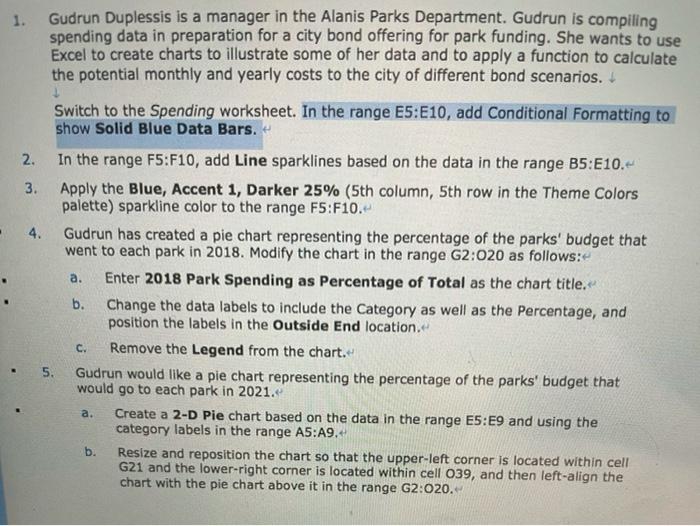
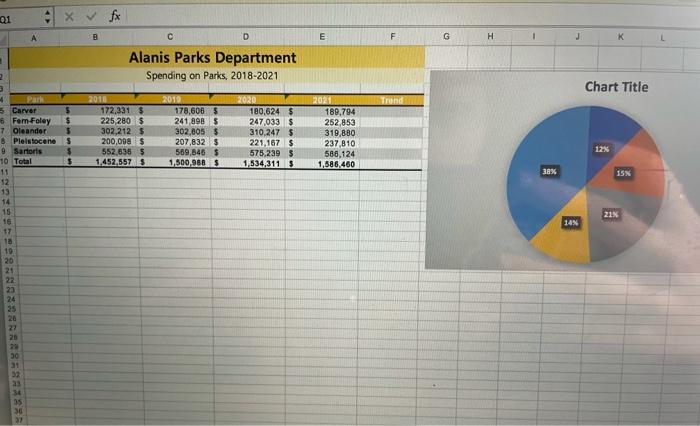
1. Gudrun Duplessis is a manager in the Alanis Parks Department. Gudrun is compiling spending data in preparation for a city bond offering for park funding. She wants to use Excel to create charts to illustrate some of her data and to apply a function to calculate the potential monthly and yearly costs to the city of different bond scenarios. Switch to the Spending worksheet. In the range E5:E10, add Conditional Formatting to show Solid Blue Data Bars. 2. In the range F5:F10, add Line sparklines based on the data in the range B5:E10. 3. Apply the Blue, Accent 1, Darker 25% (5th column, 5th row in the Theme Colors palette) sparkline color to the range F5:F10- 4. Gudrun has created a pie chart representing the percentage of the parks' budget that went to each park in 2018. Modify the chart in the range G2:020 as follows: a. Enter 2018 Park Spending as Percentage of Total as the chart title. b. Change the data labels to include the Category as well as the Percentage, and position the labels in the Outside End location. c. Remove the Legend from the chart. 5. Gudrun would like a pie chart representing the percentage of the parks' budget that would go to each park in 2021. Create a 2-D Pie chart based on the data in the range E5:E9 and using the category labels in the range AS:A9. b. Resize and reposition the chart so that the upper-left corner is located within cell G21 and the lower-right corner is located within cell 039, and then left-align the chart with the pie chart above it in the range G2:020. a. 01 fx D E F G H 1 J K L C Alanis Parks Department Spending on Parks, 2018-2021 Chart Title 2020 Trend 5 $ 2014 172.331 $ 225 2805 302.212 5 200,098 552,636 $ 1,452,557 5 2010 178,6085 241 898 $ 302,6053 207,8325 589,846 $ 1,500,988 2021 189,794 252,853 319,880 237,810 586,124 1,586,460 180,624 $ 247,033 $ 310,247 $ 221,167 $ 575,239 $ 1534,311 S 5 $ $ 12% 38% 15% Park 6 Carver 6 Fem Foley 7 Oleander 8 Pleistocene 9 Sartoris 10 Total 11 12 13 14 15 16 17 18 19 20 21 21% 14N 23 24 35 26 27 26 30 31 32 23 30 35 30 22 1. Gudrun Duplessis is a manager in the Alanis Parks Department. Gudrun is compiling spending data in preparation for a city bond offering for park funding. She wants to use Excel to create charts to illustrate some of her data and to apply a function to calculate the potential monthly and yearly costs to the city of different bond scenarios. Switch to the Spending worksheet. In the range E5:E10, add Conditional Formatting to show Solid Blue Data Bars. 2. In the range F5:F10, add Line sparklines based on the data in the range B5:E10. 3. Apply the Blue, Accent 1, Darker 25% (5th column, 5th row in the Theme Colors palette) sparkline color to the range F5:F10- 4. Gudrun has created a pie chart representing the percentage of the parks' budget that went to each park in 2018. Modify the chart in the range G2:020 as follows: a. Enter 2018 Park Spending as Percentage of Total as the chart title. b. Change the data labels to include the Category as well as the Percentage, and position the labels in the Outside End location. c. Remove the Legend from the chart. 5. Gudrun would like a pie chart representing the percentage of the parks' budget that would go to each park in 2021. Create a 2-D Pie chart based on the data in the range E5:E9 and using the category labels in the range AS:A9. b. Resize and reposition the chart so that the upper-left corner is located within cell G21 and the lower-right corner is located within cell 039, and then left-align the chart with the pie chart above it in the range G2:020. a. 01 fx D E F G H 1 J K L C Alanis Parks Department Spending on Parks, 2018-2021 Chart Title 2020 Trend 5 $ 2014 172.331 $ 225 2805 302.212 5 200,098 552,636 $ 1,452,557 5 2010 178,6085 241 898 $ 302,6053 207,8325 589,846 $ 1,500,988 2021 189,794 252,853 319,880 237,810 586,124 1,586,460 180,624 $ 247,033 $ 310,247 $ 221,167 $ 575,239 $ 1534,311 S 5 $ $ 12% 38% 15% Park 6 Carver 6 Fem Foley 7 Oleander 8 Pleistocene 9 Sartoris 10 Total 11 12 13 14 15 16 17 18 19 20 21 21% 14N 23 24 35 26 27 26 30 31 32 23 30 35 30 22Step by Step Solution
There are 3 Steps involved in it
Step: 1

Get Instant Access to Expert-Tailored Solutions
See step-by-step solutions with expert insights and AI powered tools for academic success
Step: 2

Step: 3

Ace Your Homework with AI
Get the answers you need in no time with our AI-driven, step-by-step assistance
Get Started


