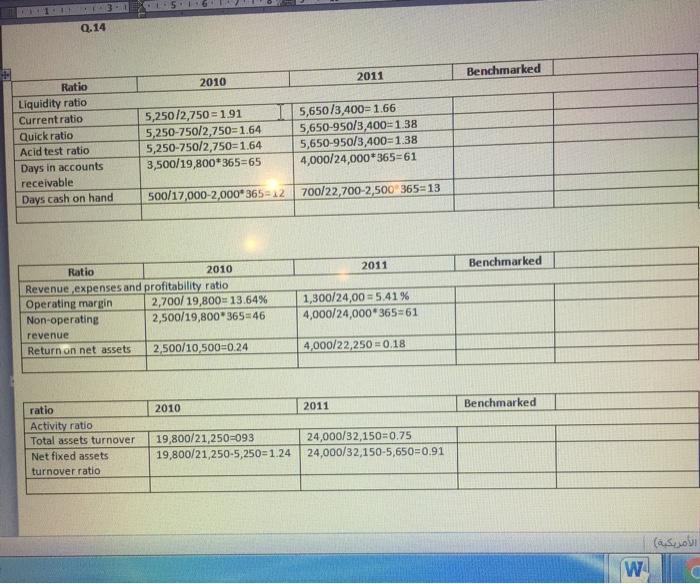
how can i calculate the benchmarked , what is the formula ?
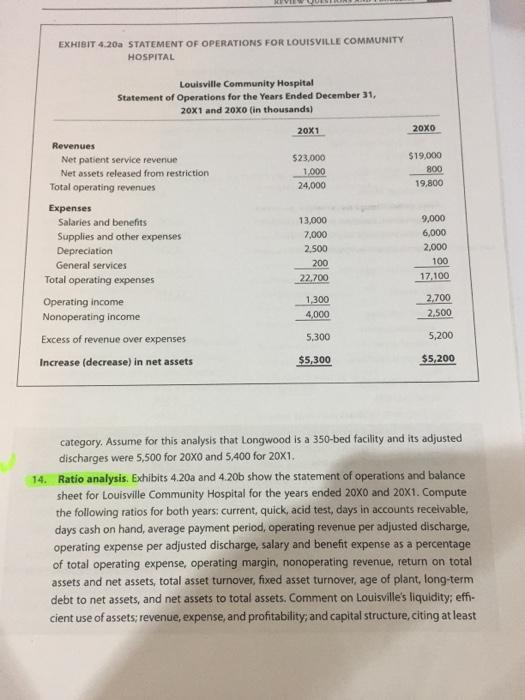
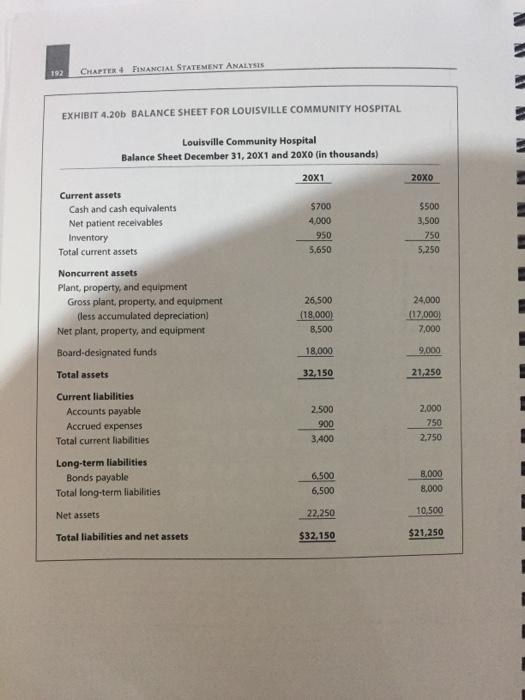
Q.14 2011 Benchmarked 2010 Ratio Liquidity ratio Current ratio Quick ratio Acid test ratio Days in accounts receivable Days cash on hand 5,250/2,750 = 191 5,250-750/2,750=1.64 5,250-750/2,750=1,64 3,500/19,800*365=65 5,650/3,400= 1.66 5,650-950/3,400=1.38 5,650-950/3,400=1.38 4,000/24,000*365=61 500/17,000 2,000*36512 700/22,700 2,500 365-13 2011 Benchmarked Ratio 2010 Revenue,expenses and profitability ratio Operating margin 2,700/ 19,800= 13.64% Non-operating 2,500/19,800*365:46 revenue Return on net assets 2,500/10,500=0.24 1,300/24,00 = 5.41% 4,000/24,000*36561 4,000/22,250 +0.18 2010 2011 Benchmarked ratio Activity ratio Total assets turnover Net fixed assets turnoverratio 19,800/21,250=093 24,000/32,150=0.75 19,800/21,250-5,250=124 24,000/32,150-5,650=0.91 ( WI EXHIBIT 4.200 STATEMENT OF OPERATIONS FOR LOUISVILLE COMMUNITY HOSPITAL Louisville Community Hospital Statement of Operations for the Years Ended December 31, 20x1 and 20xo (in thousands) 20X1 20X0 523,000 1.000 24,000 $19.000 800 19,800 Revenues Net patient service revenue Net assets released from restriction Total operating revenues Expenses Salaries and benefits Supplies and other expenses Depreciation General services Total operating expenses Operating income Nonoperating income Excess of revenue over expenses Increase (decrease) in net assets 13,000 7,000 2.500 200 22.700 9,000 6,000 2,000 100 17,100 1,300 2.700 2.500 4,000 5,300 5,200 $5,300 $5,200 category, Assume for this analysis that Longwood is a 350-bed facility and its adjusted discharges were 5,500 for 20x0 and 5.400 for 20x1. 14. Ratio analysis. Exhibits 4.20a and 4.20b show the statement of operations and balance sheet for Louisville Community Hospital for the years ended 20X0 and 20X1. Compute the following ratios for both years: current, quick, acid test, days in accounts receivable, days cash on hand, average payment period, operating revenue per adjusted discharge, operating expense per adjusted discharge salary and benefit expense as a percentage of total operating expense, operating margin, nonoperating revenue, return on total assets and net assets, total asset turnover, fixed asset turnover, age of plant, long-term debt to net assets, and net assets to total assets. Comment on Louisville's liquidity; effi- cient use of assets; revenue, expense, and profitability, and capital structure, citing at least 192 CHAPTER 4 FINANCIAL STATEMENT ANALYSIS EXHIBIT 4.205 BALANCE SHEET FOR LOUISVILLE COMMUNITY HOSPITAL Louisville Community Hospital Balance Sheet December 31, 20X1 and 20X0 (in thousands) 20X1 2OXO $700 4,000 950 5,650 $500 3,500 750 5.250 Current assets Cash and cash equivalents Net patient receivables Inventory Total current assets Noncurrent assets Plant, property, and equipment Gross plant, property, and equipment (less accumulated depreciation) Net plant property, and equipment Board-designated funds 26,500 (18,000) 8,500 24,000 (17.000) 7,000 18,000 9,000 Total assets 32,150 21,250 2,000 2.500 900 3,400 750 2.73 Current liabilities Accounts payable Accrued expenses Total current liabilities Long-term liabilities Bonds payable Total long-term liabilities 6,500 6,500 8.000 8,000 Net assets 22,250 10,500 Total liabilities and net assets $32.150 $21,250 Q.14 2011 Benchmarked 2010 Ratio Liquidity ratio Current ratio Quick ratio Acid test ratio Days in accounts receivable Days cash on hand 5,250/2,750 = 191 5,250-750/2,750=1.64 5,250-750/2,750=1,64 3,500/19,800*365=65 5,650/3,400= 1.66 5,650-950/3,400=1.38 5,650-950/3,400=1.38 4,000/24,000*365=61 500/17,000 2,000*36512 700/22,700 2,500 365-13 2011 Benchmarked Ratio 2010 Revenue,expenses and profitability ratio Operating margin 2,700/ 19,800= 13.64% Non-operating 2,500/19,800*365:46 revenue Return on net assets 2,500/10,500=0.24 1,300/24,00 = 5.41% 4,000/24,000*36561 4,000/22,250 +0.18 2010 2011 Benchmarked ratio Activity ratio Total assets turnover Net fixed assets turnoverratio 19,800/21,250=093 24,000/32,150=0.75 19,800/21,250-5,250=124 24,000/32,150-5,650=0.91 ( WI EXHIBIT 4.200 STATEMENT OF OPERATIONS FOR LOUISVILLE COMMUNITY HOSPITAL Louisville Community Hospital Statement of Operations for the Years Ended December 31, 20x1 and 20xo (in thousands) 20X1 20X0 523,000 1.000 24,000 $19.000 800 19,800 Revenues Net patient service revenue Net assets released from restriction Total operating revenues Expenses Salaries and benefits Supplies and other expenses Depreciation General services Total operating expenses Operating income Nonoperating income Excess of revenue over expenses Increase (decrease) in net assets 13,000 7,000 2.500 200 22.700 9,000 6,000 2,000 100 17,100 1,300 2.700 2.500 4,000 5,300 5,200 $5,300 $5,200 category, Assume for this analysis that Longwood is a 350-bed facility and its adjusted discharges were 5,500 for 20x0 and 5.400 for 20x1. 14. Ratio analysis. Exhibits 4.20a and 4.20b show the statement of operations and balance sheet for Louisville Community Hospital for the years ended 20X0 and 20X1. Compute the following ratios for both years: current, quick, acid test, days in accounts receivable, days cash on hand, average payment period, operating revenue per adjusted discharge, operating expense per adjusted discharge salary and benefit expense as a percentage of total operating expense, operating margin, nonoperating revenue, return on total assets and net assets, total asset turnover, fixed asset turnover, age of plant, long-term debt to net assets, and net assets to total assets. Comment on Louisville's liquidity; effi- cient use of assets; revenue, expense, and profitability, and capital structure, citing at least 192 CHAPTER 4 FINANCIAL STATEMENT ANALYSIS EXHIBIT 4.205 BALANCE SHEET FOR LOUISVILLE COMMUNITY HOSPITAL Louisville Community Hospital Balance Sheet December 31, 20X1 and 20X0 (in thousands) 20X1 2OXO $700 4,000 950 5,650 $500 3,500 750 5.250 Current assets Cash and cash equivalents Net patient receivables Inventory Total current assets Noncurrent assets Plant, property, and equipment Gross plant, property, and equipment (less accumulated depreciation) Net plant property, and equipment Board-designated funds 26,500 (18,000) 8,500 24,000 (17.000) 7,000 18,000 9,000 Total assets 32,150 21,250 2,000 2.500 900 3,400 750 2.73 Current liabilities Accounts payable Accrued expenses Total current liabilities Long-term liabilities Bonds payable Total long-term liabilities 6,500 6,500 8.000 8,000 Net assets 22,250 10,500 Total liabilities and net assets $32.150 $21,250