Answered step by step
Verified Expert Solution
Question
1 Approved Answer
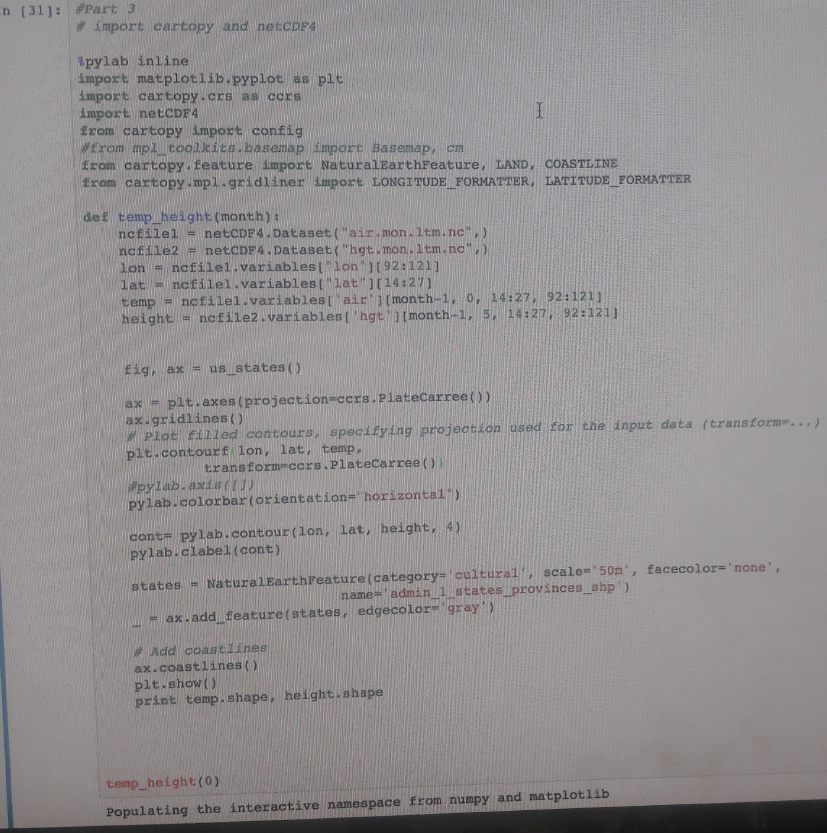
How can I change the colorbar range to go from -20 to 20? [on mac computer, python 2.7] n [31]: Part 3 import cartopy and

How can I change the colorbar range to go from -20 to 20? [on mac computer, python 2.7]
n [31]: Part 3 import cartopy and netCDF4 ipylab inline impozt matplotiib.pyplot as plu import cartopy crs as cers import netCDFA from cartopy import config trom mpl toolkice. basemap import Basemap, from cartopy feature import NaturalBarthPeature. LAND, COASTLINE f rom cartopy mpl.gridiliner import LoKGTTUDE PORMATTER, LATITUDE PORKAPTER def temp height- (month) ric file2 # netCDF 4. Dataset( "hgt-mon. Itm.nc ".) lon = ncfile1.variables ["1on.)(92:121] Lat!= ncfile1 .variables [ "Zat.)( 14:27) temp nC filel.variables ['air, ] [month-1. 0, 14:27, 92:121] height = ncfile2 .variables ['hgt i] [month-1,15, 14:27. 92:121 Eig, axus states( ax #pit.axes (projection-cers. PlateCarree()) ax.gridlines () Piot filled contours, specitying projeotion used fox the input data (transform-...) plt contourf lon, lat temp, trans tormycors.Platecarree() pylab.colorbar (orientation-"horizontal) contr Pylab-contour (lon, lat, height, 4) Pylab.clabel (cont) re ( category='cultural, scale-'50n', name-adminlil states provinces shp ) states = NaturalEarthPeat facecolor-"none', lax add feature(states edgecolor grayh) Add coastlines ax.coastlines () pit.show() print temp. shape, height.shape temp height (0) Populating the interactive namespace from numpy and matplotlibStep by Step Solution
There are 3 Steps involved in it
Step: 1

Get Instant Access to Expert-Tailored Solutions
See step-by-step solutions with expert insights and AI powered tools for academic success
Step: 2

Step: 3

Ace Your Homework with AI
Get the answers you need in no time with our AI-driven, step-by-step assistance
Get Started


