

Answered step by step
Verified Expert Solution
Question
1 Approved Answer
how can I contact you Use the data given in the table below for solving the questions. Enter, the assumed number of working days for
how can I contact you
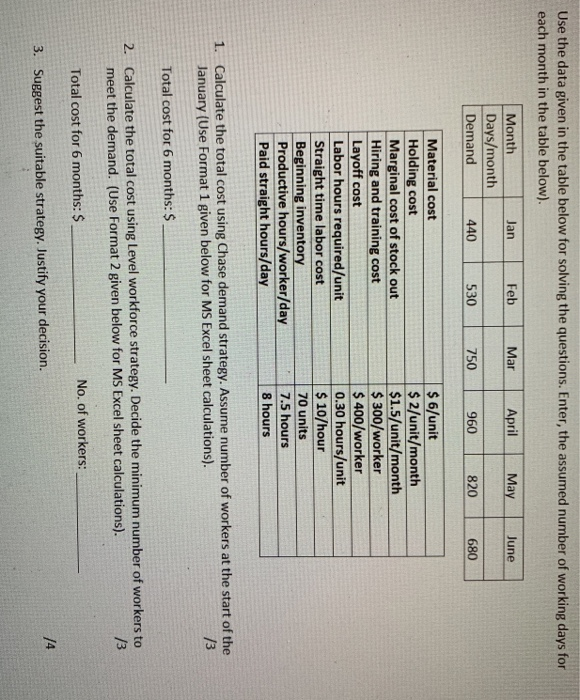
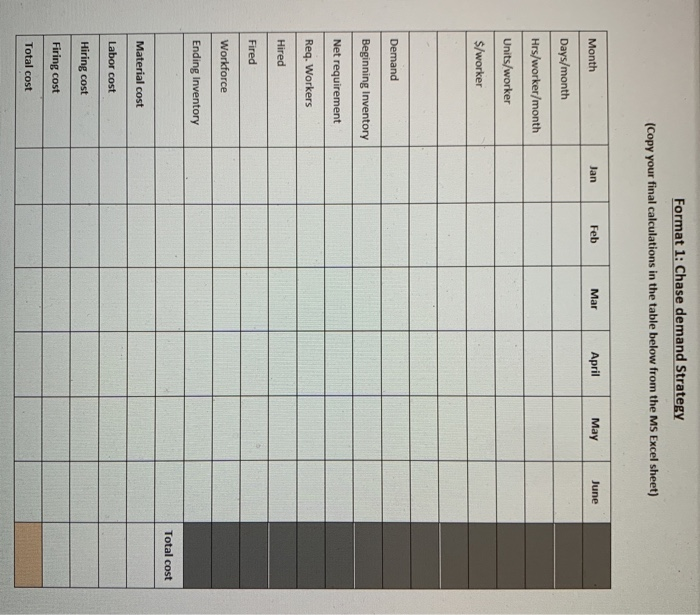
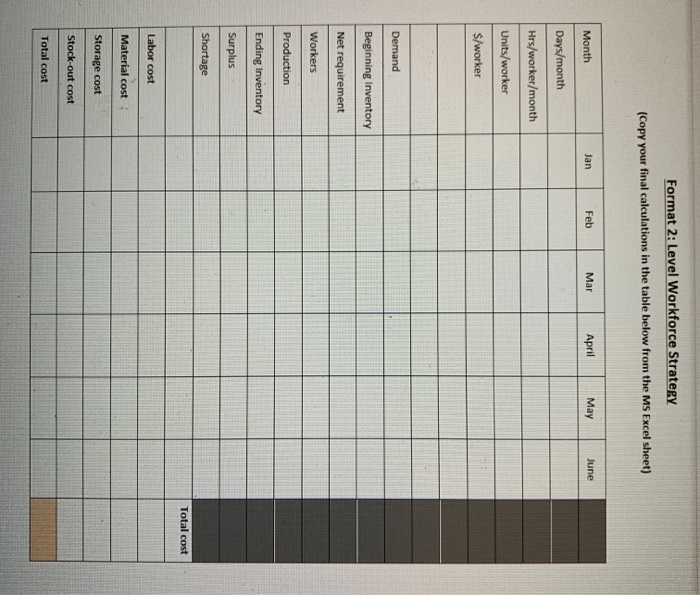
Use the data given in the table below for solving the questions. Enter, the assumed number of working days for each month in the table below). Jan Feb Mar April May June Month Days/month Demand 440 530 750 960 820 680 Material cost Holding cost Marginal cost of stock out Hiring and training cost Layoff cost Labor hours required/unit Straight time labor cost Beginning inventory Productive hours/worker/day Paid straight hours/day $ 6/unit $ 2/unit/month $1.5/unit/month $ 300/worker $ 400/worker 0.30 hours/unit $ 10/hour 70 units 7.5 hours 8 hours 1. Calculate the total cost using Chase demand strategy. Assume number of workers at the start of the January (Use Format 1 given below for MS Excel sheet calculations). 13 Total cost for 6 months: $ 2. Calculate the total cost using Level workforce strategy. Decide the minimum number of workers to meet the demand. (Use Format 2 given below for MS Excel sheet calculations). 13 Total cost for 6 months: $ No. of workers: 3. Suggest the suitable strategy. Justify your decision. The following submission to be uploaded on the BBLearn 1. This completed file (3 pages) with your answer for Q3 above (pdf format). 2. MS Excel file containing Format 1 and Format 2 calculations (MS excel file). Format 1: Chase demand Strategy (Copy your final calculations in the table below from the MS Excel sheet) Month Jan Feb Mar April May June Days/month Hrs/worker/month Units/worker $/worker Demand Beginning Inventory Net requirement Req. Workers Hired Fired Workforce Ending Inventory Total cost Material cost Labor cost Hiring cost Firing cost Total cost Format 2: Level Workforce Strategy (Copy your final calculations in the table below from the MS Excel sheet) Month Jan Feb Mar April May June Days/month Hrs/worker/month Units/worker $/worker Demand Beginning inventory Net requirement Workers Production Ending Inventory Surplus Shortage Total cost Labor cost Material cost Storage cost Stock-out cost Total cost Use the data given in the table below for solving the questions. Enter, the assumed number of working days for each month in the table below). Jan Feb Mar April May June Month Days/month Demand 440 530 750 960 820 680 Material cost Holding cost Marginal cost of stock out Hiring and training cost Layoff cost Labor hours required/unit Straight time labor cost Beginning inventory Productive hours/worker/day Paid straight hours/day $ 6/unit $ 2/unit/month $1.5/unit/month $ 300/worker $ 400/worker 0.30 hours/unit $ 10/hour 70 units 7.5 hours 8 hours 1. Calculate the total cost using Chase demand strategy. Assume number of workers at the start of the January (Use Format 1 given below for MS Excel sheet calculations). 13 Total cost for 6 months: $ 2. Calculate the total cost using Level workforce strategy. Decide the minimum number of workers to meet the demand. (Use Format 2 given below for MS Excel sheet calculations). 13 Total cost for 6 months: $ No. of workers: 3. Suggest the suitable strategy. Justify your decision. The following submission to be uploaded on the BBLearn 1. This completed file (3 pages) with your answer for Q3 above (pdf format). 2. MS Excel file containing Format 1 and Format 2 calculations (MS excel file). Format 1: Chase demand Strategy (Copy your final calculations in the table below from the MS Excel sheet) Month Jan Feb Mar April May June Days/month Hrs/worker/month Units/worker $/worker Demand Beginning Inventory Net requirement Req. Workers Hired Fired Workforce Ending Inventory Total cost Material cost Labor cost Hiring cost Firing cost Total cost Format 2: Level Workforce Strategy (Copy your final calculations in the table below from the MS Excel sheet) Month Jan Feb Mar April May June Days/month Hrs/worker/month Units/worker $/worker Demand Beginning inventory Net requirement Workers Production Ending Inventory Surplus Shortage Total cost Labor cost Material cost Storage cost Stock-out cost Total cost Step by Step Solution
There are 3 Steps involved in it
Step: 1

Get Instant Access to Expert-Tailored Solutions
See step-by-step solutions with expert insights and AI powered tools for academic success
Step: 2

Step: 3
Ace Your Homework with AI
Get the answers you need in no time with our AI-driven, step-by-step assistance
Get Started
Payroll Fraud Detection And Prevention Audit Expert System
Authors: Titus Oniyilo
1st Edition
136564345X, 978-1365643453