How can i edit the python code to reflect problem #2? Thanks
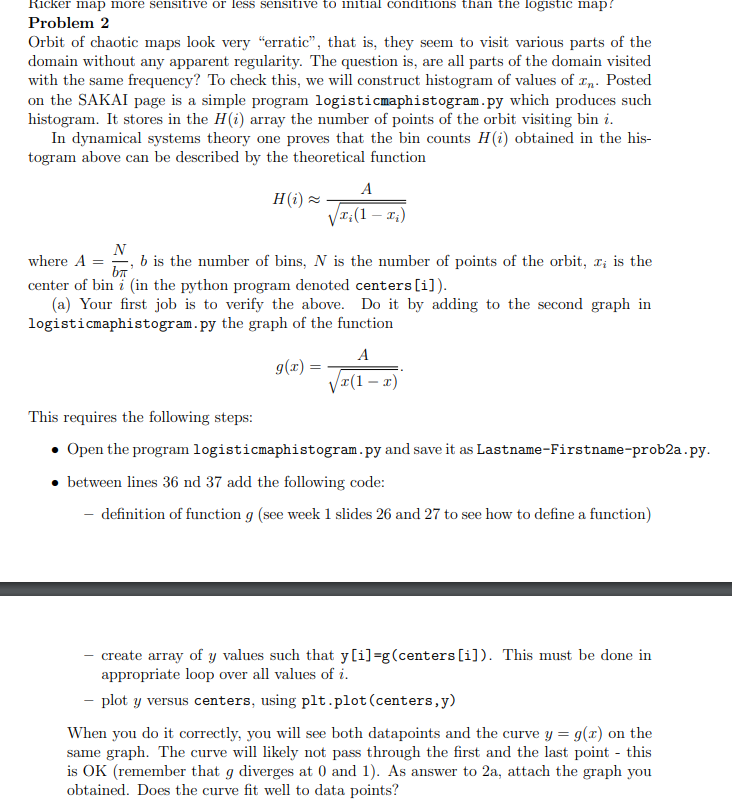
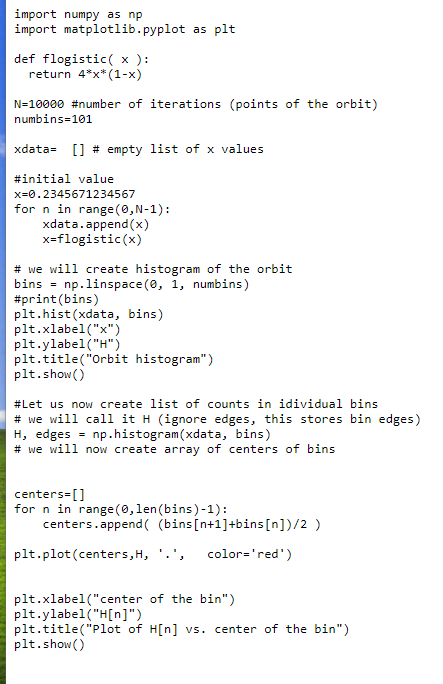
Ricker map more sensitive or less sensitive to initial conditions than the logistic map! Problem 2 Orbit of chaotic maps look very "erratic", that is, they seem to visit various parts of the domain without any apparent regularity. The question is, are all parts of the domain visited with the same frequency? To check this, we will construct histogram of values of In. Posted on the SAKAI page is a simple program logisticmaphistogram.py which produces such histogram. It stores in the H(i) array the number of points of the orbit visiting bin i. In dynamical systems theory one proves that the bin counts H(i) obtained in the his- togram above can be described by the theoretical function H(i) - Vr:(1 - 1;) N where A = b is the number of bins, N is the number of points of the orbit, I; is the ba center of bin i (in the python program denoted centers[i]). (a) Your first job is to verify the above. Do it by adding to the second graph in logisticmaphistogram.py the graph of the function g(1) = *(1 3) This requires the following steps: Open the program logisticmaphistogram.py and save it as Lastname-Firstname-prob2a.py. between lines 36 nd 37 add the following code: - definition of function g (see week 1 slides 26 and 27 to see how to define a function) create array of y values such that y[i]=g(centers[i]). This must be done in appropriate loop over all values of i. - plot y versus centers, using plt.plot(centers,y) When you do it correctly, you will see both datapoints and the curve y = g() on the same graph. The curve will likely not pass through the first and the last point - this is OK (remember that g diverges at 0 and 1). As answer to 2a, attach the graph you obtained. Does the curve fit well to data points? import numpy as np import matplotlib.pyplot as plt def flogistic( x ): return 4*x*(1-x) N=10000 #number of iterations (points of the orbit) numbins=101 xdata= [] # empty list of x values #initial value x=0.2345671234567 for n in range(0,N-1): xdata.append(x) x=flogistic(x) # we will create histogram of the orbit bins = np.linspace(0, 1, numbins) #print(bins) plt.hist(xdata, bins) plt.xlabel("x") plt.ylabel("") plt.title("Orbit histogram") plt.show() #Let us now create list of counts in idividual bins # we will call it H (ignore edges, this stores bin edges) H, edges = np.histogram(xdata, bins) # we will now create array of centers of bins centers [] for n in range(0, len(bins)-1): centers.append( (bins (n+1]+bins[n])/2 ) plt.plot(centers,H, '.', color='red') plt.xlabel("center of the bin") plt.ylabel("H[n]") plt.title("Plot of H[n] vs. center of the bin") plt.show() Ricker map more sensitive or less sensitive to initial conditions than the logistic map! Problem 2 Orbit of chaotic maps look very "erratic", that is, they seem to visit various parts of the domain without any apparent regularity. The question is, are all parts of the domain visited with the same frequency? To check this, we will construct histogram of values of In. Posted on the SAKAI page is a simple program logisticmaphistogram.py which produces such histogram. It stores in the H(i) array the number of points of the orbit visiting bin i. In dynamical systems theory one proves that the bin counts H(i) obtained in the his- togram above can be described by the theoretical function H(i) - Vr:(1 - 1;) N where A = b is the number of bins, N is the number of points of the orbit, I; is the ba center of bin i (in the python program denoted centers[i]). (a) Your first job is to verify the above. Do it by adding to the second graph in logisticmaphistogram.py the graph of the function g(1) = *(1 3) This requires the following steps: Open the program logisticmaphistogram.py and save it as Lastname-Firstname-prob2a.py. between lines 36 nd 37 add the following code: - definition of function g (see week 1 slides 26 and 27 to see how to define a function) create array of y values such that y[i]=g(centers[i]). This must be done in appropriate loop over all values of i. - plot y versus centers, using plt.plot(centers,y) When you do it correctly, you will see both datapoints and the curve y = g() on the same graph. The curve will likely not pass through the first and the last point - this is OK (remember that g diverges at 0 and 1). As answer to 2a, attach the graph you obtained. Does the curve fit well to data points? import numpy as np import matplotlib.pyplot as plt def flogistic( x ): return 4*x*(1-x) N=10000 #number of iterations (points of the orbit) numbins=101 xdata= [] # empty list of x values #initial value x=0.2345671234567 for n in range(0,N-1): xdata.append(x) x=flogistic(x) # we will create histogram of the orbit bins = np.linspace(0, 1, numbins) #print(bins) plt.hist(xdata, bins) plt.xlabel("x") plt.ylabel("") plt.title("Orbit histogram") plt.show() #Let us now create list of counts in idividual bins # we will call it H (ignore edges, this stores bin edges) H, edges = np.histogram(xdata, bins) # we will now create array of centers of bins centers [] for n in range(0, len(bins)-1): centers.append( (bins (n+1]+bins[n])/2 ) plt.plot(centers,H, '.', color='red') plt.xlabel("center of the bin") plt.ylabel("H[n]") plt.title("Plot of H[n] vs. center of the bin") plt.show()