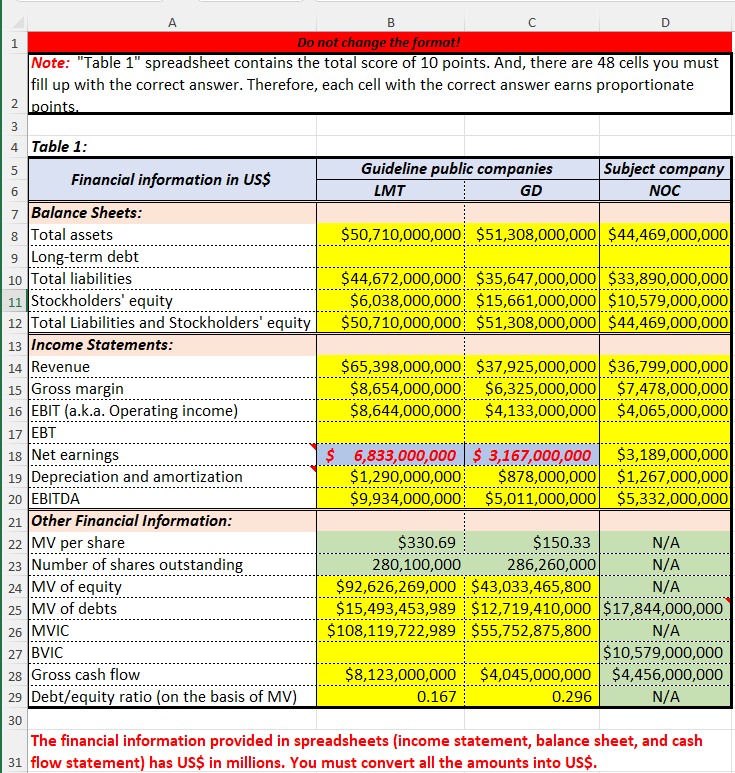
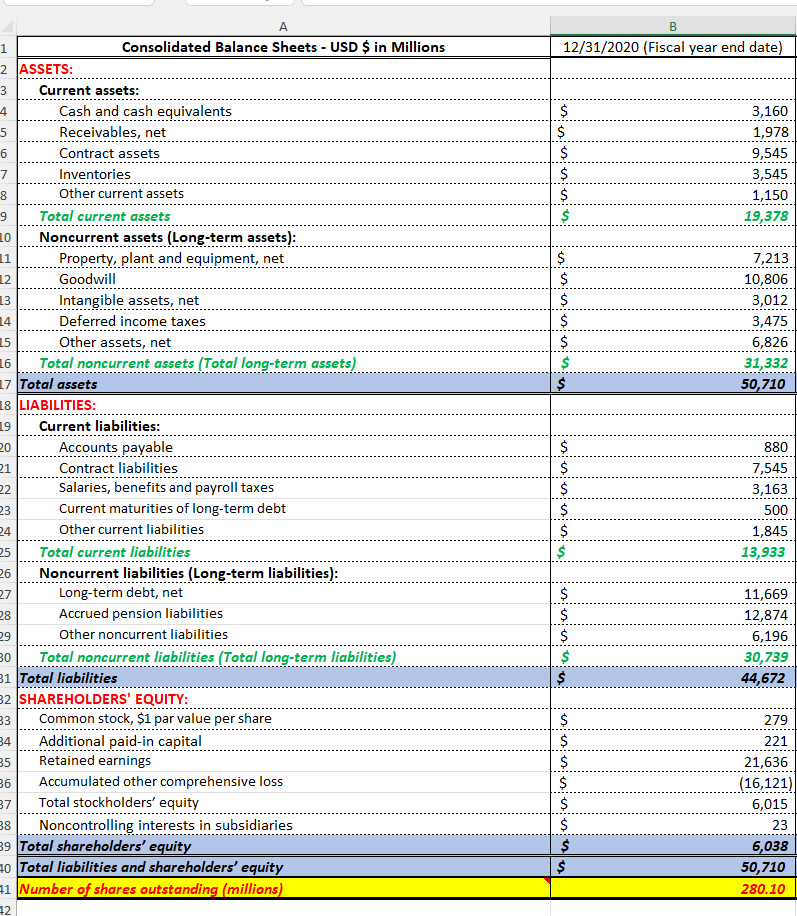
How can I find B9(above) long term debt from the balance sheet (1st picture below)
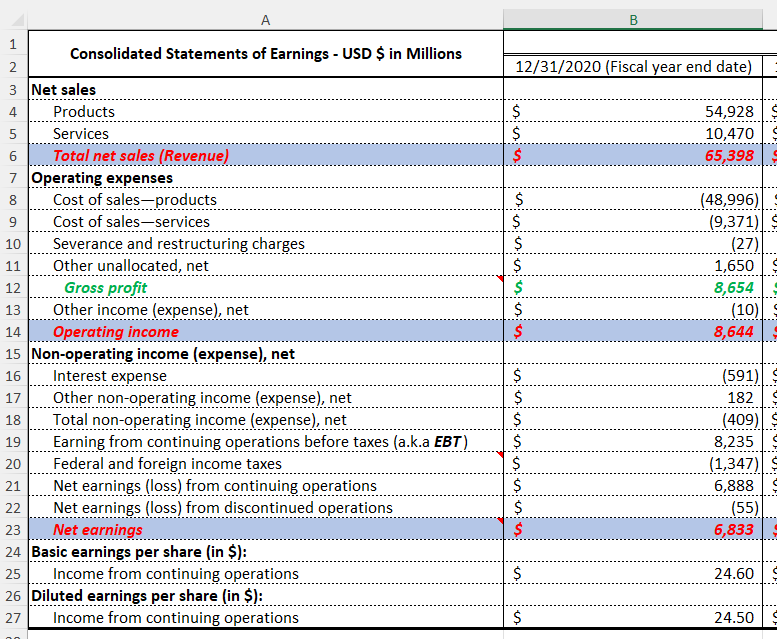
And where and how can I find B17 ( Above) EBT
If could provide an explanation would be beneficial, thank you.
A 1 B Do not change the format! Note: "Table 1" spreadsheet contains the total score of 10 points. And, there are 48 cells you must fill up with the correct answer. Therefore, each cell with the correct answer earns proportionate 2 points. 3 4 Table 1: 5 Guideline public companies Subject company Financial information in US$ 6 LMT GD NOC 7 Balance Sheets: 8 Total assets $50,710,000,000 $51,308,000,000 $44,469,000,000 9 Long-term debt 10 Total liabilities $44,672,000,000 $35,647,000,000 $33,890,000,000 11 Stockholders' equity $6,038,000,000 $15,661,000,000 $10,579,000,000 12 Total Liabilities and Stockholders' equity $50,710,000,000 $51,308,000,000 $44,469,000,000 13 Income Statements: 14 Revenue $65,398,000,000 $37,925,000,000 $36,799,000,000 15 Gross margin $8,654,000,000 $6,325,000,000 $7,478,000,000 16 EBIT (a.k.a. Operating income) $8,644,000,000 $4,133,000,000 $4,065,000,000 17 EBT 18 Net earnings $ 6,833,000,000 $ 3,167,000,000 $3,189,000,000 19 Depreciation and amortization $1,290,000,000 $878,000,000 $1,267,000,000 20 EBITDA $9,934,000,000 $5,011,000,000 $5,332,000,000 21 Other Financial Information: 22 MV per share $330.69 $150.33 N/A 23 Number of shares outstanding 280,100,000 286,260,000 N/A 24 MV of equity $92,626,269,000 $43,033,465,800 N/A 25 MV of debts $15,493,453,989 $12,719,410,000 $17,844,000,000 26 MVIC $108,119,722,989 $55,752,875,800 N/A 27 BVIC $10,579,000,000 28 Gross cash flow $8,123,000,000 $4,045,000,000 $4,456,000,000 29 Debt/equity ratio (on the basis of MV) 0.167 0.296 N/A 30 The financial information provided in spreadsheets (income statement, balance sheet, and cash 31 flow statement) has US$ in millions. You must convert all the amounts into US$. B 12/31/2020 (Fiscal year end date) $ $ $ $ $ $ 3,160 1,978 9,545 3,545 1,150 19,378 5 Winnin $ $ $ $ $ $ $ 7,213 10,806 3,012 3,475 6,826 31,332 50,710 880 A Consolidated Balance Sheets - USD $ in Millions 2 JASSETS: 3 Current assets: 4 Cash and cash equivalents 5 Receivables, net 6 Contract assets 7 Inventories 8 Other current assets 9 Total current assets 10 Noncurrent assets (Long-term assets): 11 Property, plant and equipment, net 12 Goodwill 13 Intangible assets, net 14 Deferred income taxes 15 Other assets, net 16 Total noncurrent assets (Total long-term assets) 17 Total assets 18 LIABILITIES: 19 Current liabilities: 20 Accounts payable 21 Contract liabilities 22 Salaries, benefits and payroll taxes 23 Current maturities of long-term debt 24 Other current liabilities 25 Total current liabilities 26 Noncurrent liabilities (Long-term liabilities): 27 Long-term debt, net 28 Accrued pension liabilities 29 Other noncurrent liabilities 30 Total noncurrent liabilities (Total long-term liabilities) 31 Total liabilities 82 SHAREHOLDERS' EQUITY: Common stock, $1 par value per share 34 Additional paid-in capital 35 Retained earnings 36 Accumulated other comprehensive loss 37 Total stockholders' equity 38 Noncontrolling interests in subsidiaries 9 Total shareholders' equity 70 Total liabilities and shareholders' equity 91 Number of shares outstanding (millions) $ $ $ $ $ CON UN 7,545 3,163 500 1,845 13,933 $ $ $ $ $ 11,669 12,874 6,196 30,739 44,672 33 279 221 $ $ $ $ $ $ $ $ 21,636 (16,121) 6,015 23 6,038 50,710 280.10 12 A N 12/31/2020 (Fiscal year end date) $ $ $ 54,928 10,470 65,398 1 Consolidated Statements of Earnings - USD $ in Millions 2. 3 Net sales 4 Products 5 Services 6 Total net sales (Revenue) 7 Operating expenses 8 Cost of sales-products 9 Cost of sales-services 10 Severance and restructuring charges 11 Other unallocated, net 12 Gross profit 13 Other income (expense), net 14 Operating income 15 Non-operating income (expense), net 16 Interest expense 17 Other non-operating income (expense), net 18 Total non-operating income (expense), net 19 Earning from continuing operations before taxes (a.k.a EBT) 20 Federal and foreign income taxes 21 Net earnings (loss) from continuing operations 22 Net earnings (loss) from discontinued operations 23 Net earnings 24 Basic earnings per share (in $): 25 Income from continuing operations 26 Diluted earnings per share (in $): 27 Income from continuing operations $ $ $ $ $ $ $ (48,996) (9,371) | (27) 1,650 8,654 (10) 8,644 $ $ $ $ $ $ $ $ $ (591) 182 (409) 8,235 (1,347) 6,888 (55) 6,833 $ 24.60 $ $ 24.50