Answered step by step
Verified Expert Solution
Question
1 Approved Answer
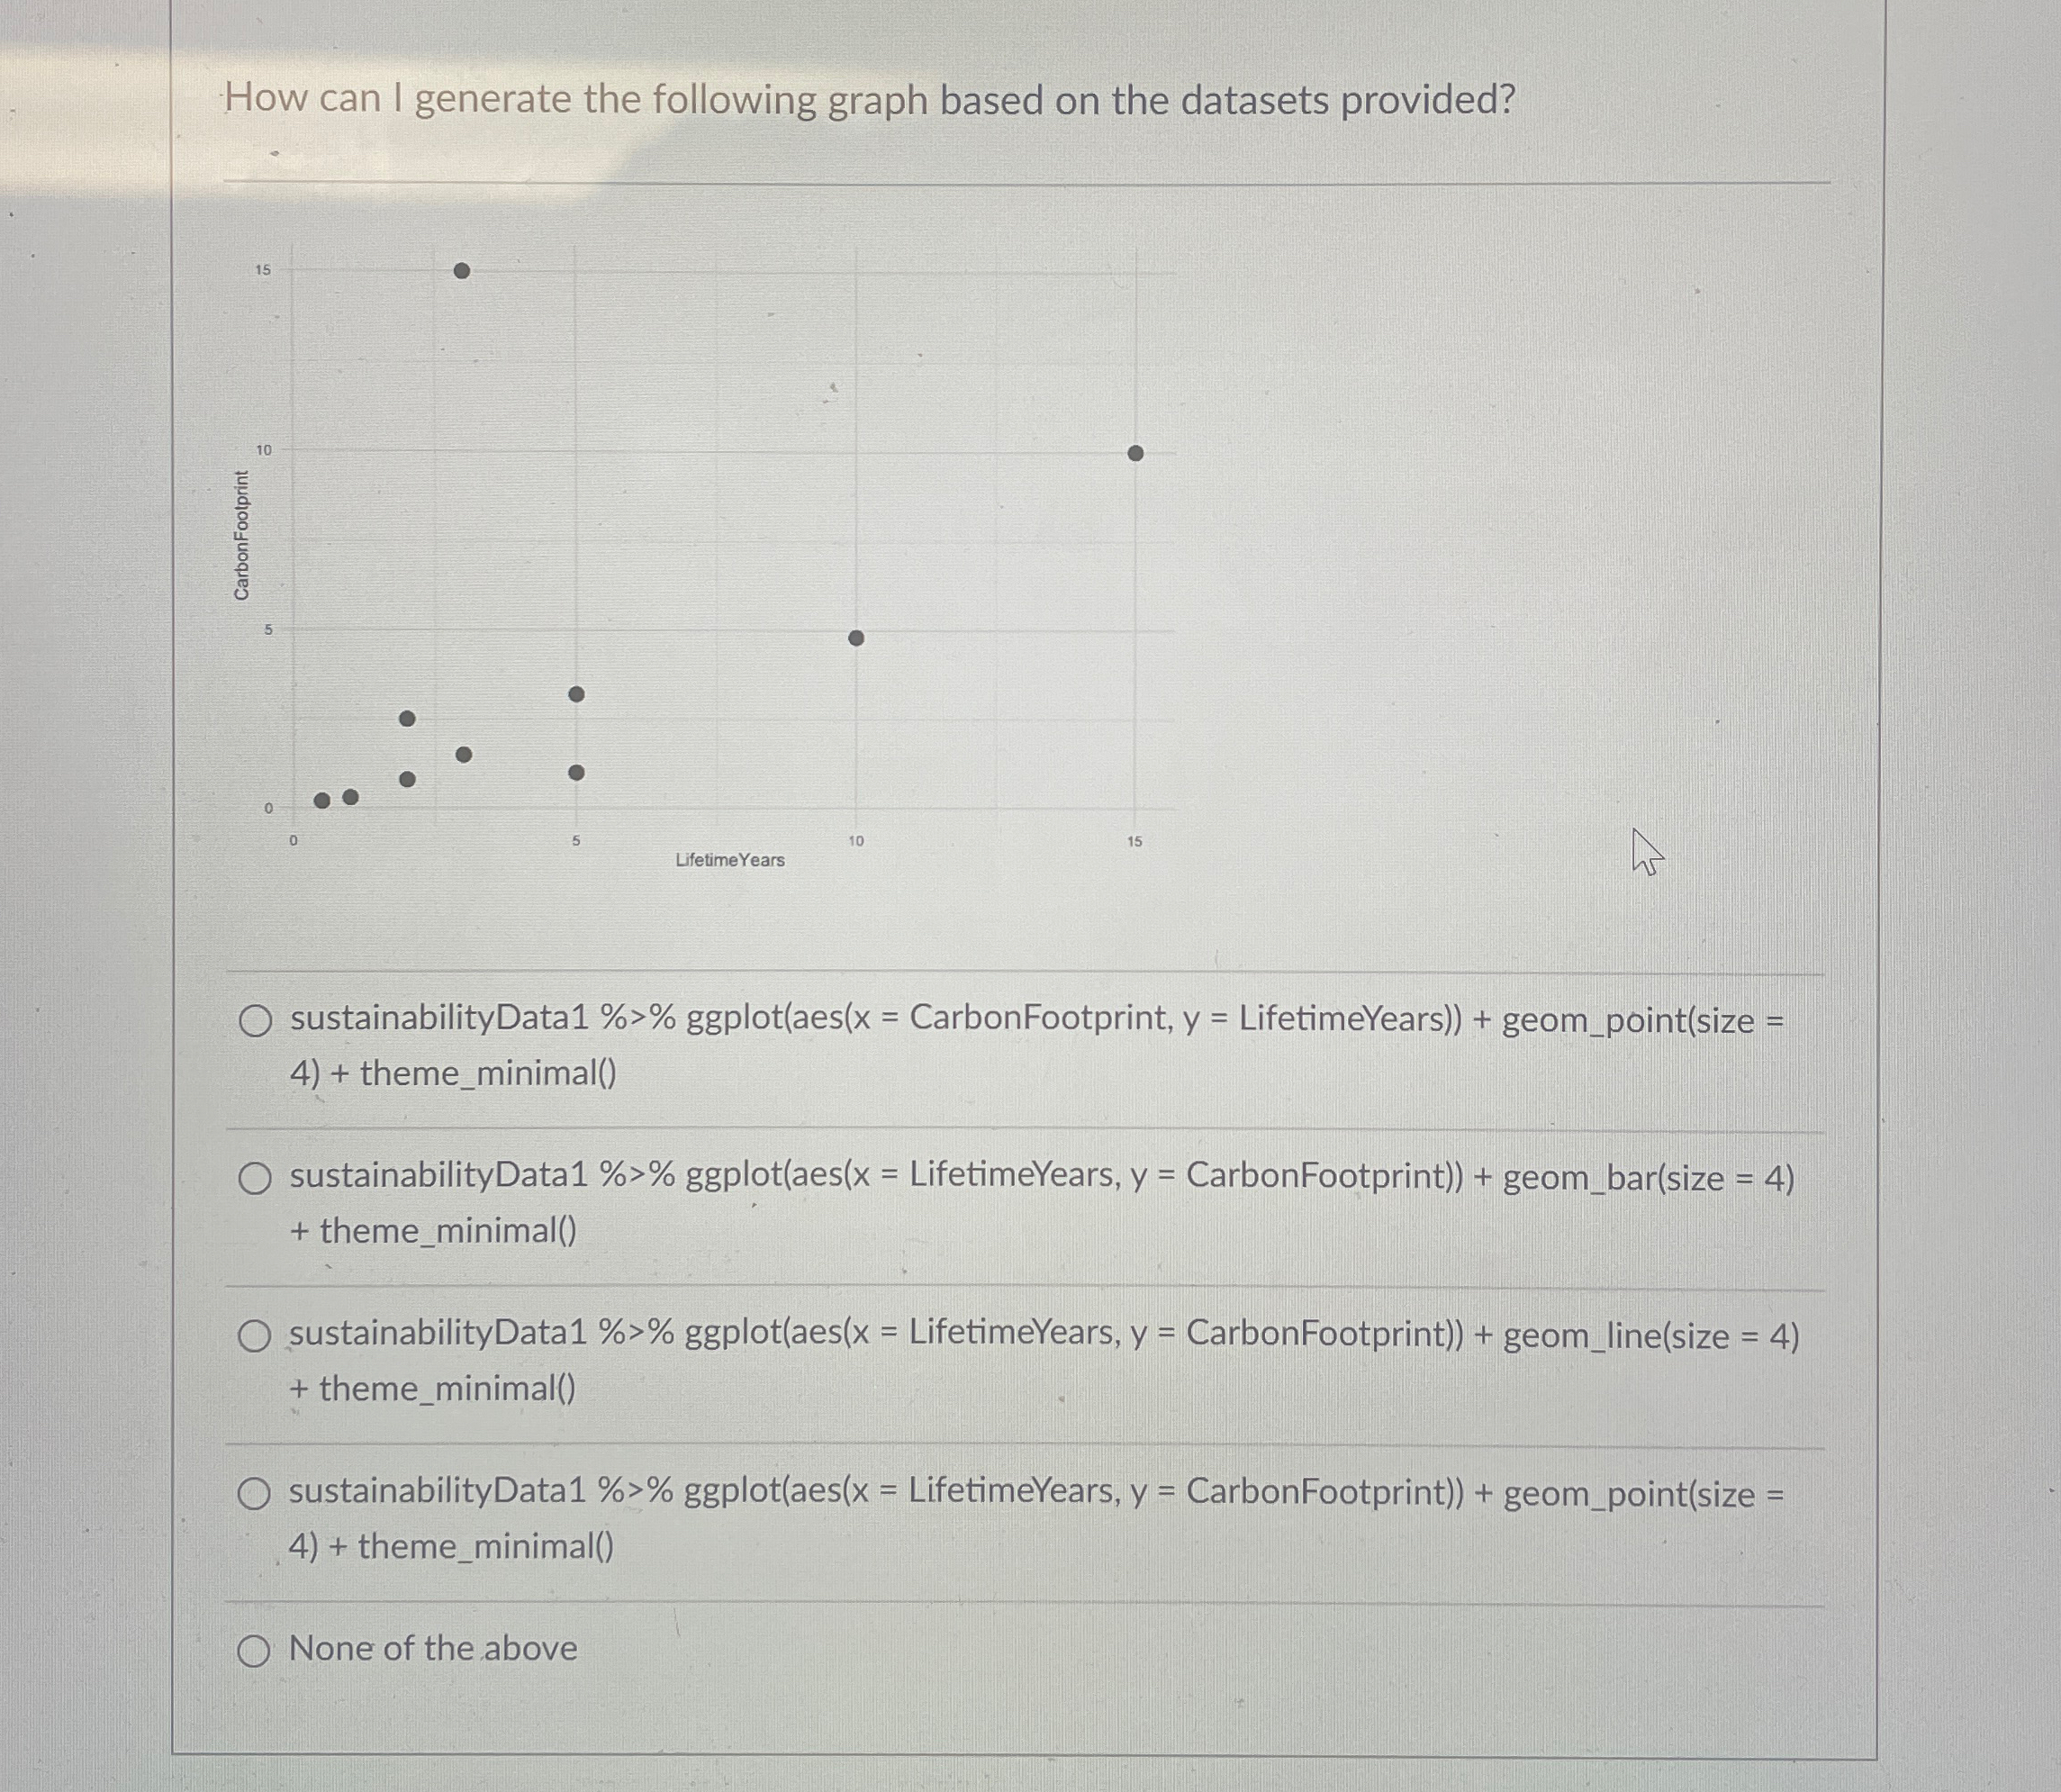
How can I generate the following graph based on the datasets provided? sustainabilityData 1 % > % ggplot ( aes ( x = CarbonFootprint, y
How can I generate the following graph based on the datasets provided?
sustainabilityData ggplotaesx CarbonFootprint, y LifetimeYears geompointsize thememinimal
sustainabilityData ggplotaesx LifetimeYears, y CarbonFootprint geombarsize thememinimal
sustainabilityData ggplotaesx LifetimeYears, CarbonFootprint geomlinesize thememinimal
sustainabilityData ggplotaesx LifetimeYears, y CarbonFootprint geompointsize thememinimal
None of the above
Step by Step Solution
There are 3 Steps involved in it
Step: 1

Get Instant Access to Expert-Tailored Solutions
See step-by-step solutions with expert insights and AI powered tools for academic success
Step: 2

Step: 3
Ace Your Homework with AI
Get the answers you need in no time with our AI-driven, step-by-step assistance
Get Started