

Answered step by step
Verified Expert Solution
Question
1 Approved Answer
How can I get Compound Annual Growth Rate (CAGR) of this company? 2000 2005 2010 2015 2016 2017 $35.9 35.1 $682.2 465.8 $2,162.6 1,357.4 $6,779.5
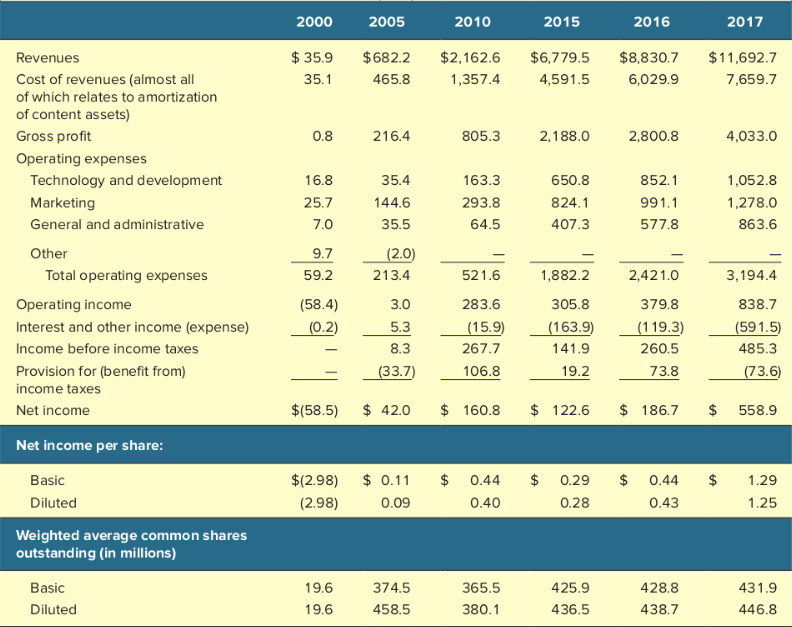
How can I get Compound Annual Growth Rate (CAGR) of this company?
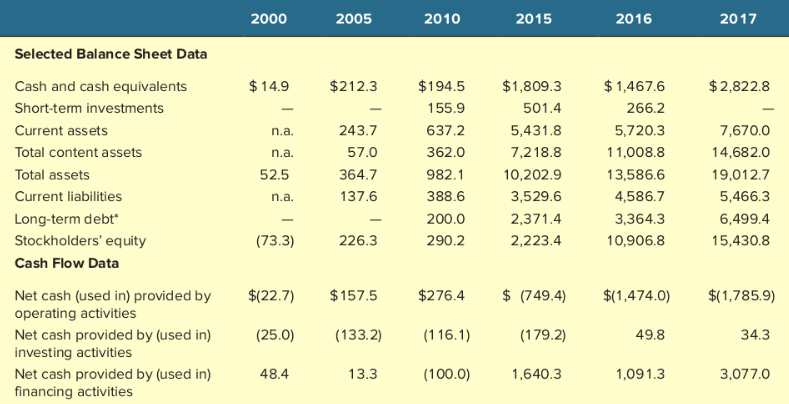
2000 2005 2010 2015 2016 2017 $35.9 35.1 $682.2 465.8 $2,162.6 1,357.4 $6,779.5 4,591.5 $8,830.7 6,029. 9 $11,692.7 7 ,659.7 0.8 216.4 805.3 2,188.0 2,800.8 4,033.0 16.8 25.7 35.4 144.6 35.5 163.3 293.8 64.5 650.8 824.1 407.3 852.1 991.1 577.8 1,052.8 1,278.0 863.6 7.0 Revenues Cost of revenues (almost all of which relates to amortization of content assets) Gross profit Operating expenses Technology and development Marketing General and administrative Other Total operating expenses Operating income Interest and other income (expense) Income before income taxes Provision for benefit from) income taxes Net income 9.7 (2.0) 213.4 59.2 521.6 3,194.4 (58.4) (0.2) 3.0 5.3 283.6 (15.9) 267.7 106.8 1,882.2 305.8 (163.9) 141.9 19.2 2,421.0 379.8 (119.3) 260.5 73.8 838.7 (591.5) 485.3 (73.6) (33.7) $(58.5) $ 42.0 $ 160.8 $ 122.6 $ 186.7 $ 558.9 Net income per share: er share: $ $ $ $ Basic Diluted $(2.98) (2.98) $ 0.11 0.09 0.44 0.40 0.29 0.28 0.44 0.43 1.29 1.25 Weighted average common shares outstanding in millions) 4 Basic Diluted 19.6 19.6 374.5 458.5 365.5 380.1 425. 9 436.5 28.8 438.7 431.9 446.8 2000 2005 2010 2015 2016 2017 Selected Balance Sheet Data $212.3 $2,822.8 $14.9 - n.a. n.a. Cash and cash equivalents Short-term investments Current assets Total content assets Total assets Current liabilities Long-term debt Stockholders' equity Cash Flow Data 243.7 57.0 364.7 137.6 $194.5 155.9 637.2 362.0 982.1 388.6 200.0 290.2 $1,809.3 501.4 5,431.8 7,218.8 10,202.9 3,529.6 2,371.4 2,223.4 $ 1,467.6 266.2 5,720.3 11,008.8 13,586.6 4,586.7 3,364.3 10,906.8 52.5 na. 7,670.0 14,682.0 19,012.7 5,466.3 6,499.4 15,430.8 (73.3) 226.3 $(22.7) $157.5 $276.4 $ (749.4) $(1,474.0) $(1,785.9) Net cash (used in provided by operating activities Net cash provided by (used in) investing activities Net cash provided by (used in) financing activities (25.0) (133.2) (116.1) (179.2) 49.8 34.3 48.4 13.3 (100.0) 1,640.3 1,091.3 3,077.0 2000 2005 2010 2015 2016 2017 $35.9 35.1 $682.2 465.8 $2,162.6 1,357.4 $6,779.5 4,591.5 $8,830.7 6,029. 9 $11,692.7 7 ,659.7 0.8 216.4 805.3 2,188.0 2,800.8 4,033.0 16.8 25.7 35.4 144.6 35.5 163.3 293.8 64.5 650.8 824.1 407.3 852.1 991.1 577.8 1,052.8 1,278.0 863.6 7.0 Revenues Cost of revenues (almost all of which relates to amortization of content assets) Gross profit Operating expenses Technology and development Marketing General and administrative Other Total operating expenses Operating income Interest and other income (expense) Income before income taxes Provision for benefit from) income taxes Net income 9.7 (2.0) 213.4 59.2 521.6 3,194.4 (58.4) (0.2) 3.0 5.3 283.6 (15.9) 267.7 106.8 1,882.2 305.8 (163.9) 141.9 19.2 2,421.0 379.8 (119.3) 260.5 73.8 838.7 (591.5) 485.3 (73.6) (33.7) $(58.5) $ 42.0 $ 160.8 $ 122.6 $ 186.7 $ 558.9 Net income per share: er share: $ $ $ $ Basic Diluted $(2.98) (2.98) $ 0.11 0.09 0.44 0.40 0.29 0.28 0.44 0.43 1.29 1.25 Weighted average common shares outstanding in millions) 4 Basic Diluted 19.6 19.6 374.5 458.5 365.5 380.1 425. 9 436.5 28.8 438.7 431.9 446.8 2000 2005 2010 2015 2016 2017 Selected Balance Sheet Data $212.3 $2,822.8 $14.9 - n.a. n.a. Cash and cash equivalents Short-term investments Current assets Total content assets Total assets Current liabilities Long-term debt Stockholders' equity Cash Flow Data 243.7 57.0 364.7 137.6 $194.5 155.9 637.2 362.0 982.1 388.6 200.0 290.2 $1,809.3 501.4 5,431.8 7,218.8 10,202.9 3,529.6 2,371.4 2,223.4 $ 1,467.6 266.2 5,720.3 11,008.8 13,586.6 4,586.7 3,364.3 10,906.8 52.5 na. 7,670.0 14,682.0 19,012.7 5,466.3 6,499.4 15,430.8 (73.3) 226.3 $(22.7) $157.5 $276.4 $ (749.4) $(1,474.0) $(1,785.9) Net cash (used in provided by operating activities Net cash provided by (used in) investing activities Net cash provided by (used in) financing activities (25.0) (133.2) (116.1) (179.2) 49.8 34.3 48.4 13.3 (100.0) 1,640.3 1,091.3 3,077.0Step by Step Solution
There are 3 Steps involved in it
Step: 1

Get Instant Access to Expert-Tailored Solutions
See step-by-step solutions with expert insights and AI powered tools for academic success
Step: 2

Step: 3
Ace Your Homework with AI
Get the answers you need in no time with our AI-driven, step-by-step assistance
Get Started
Public Finance
Authors: Harvey S. Rosen
5th Edition
025617329X, 978-0256173291