

Question: How can I help my team go from 7th place to top three for Year 12? FINANCIAL STATEMENTS Year 11 83.354 Income Statement (5000) AC
How can I help my team go from 7th place to top three for Year 12?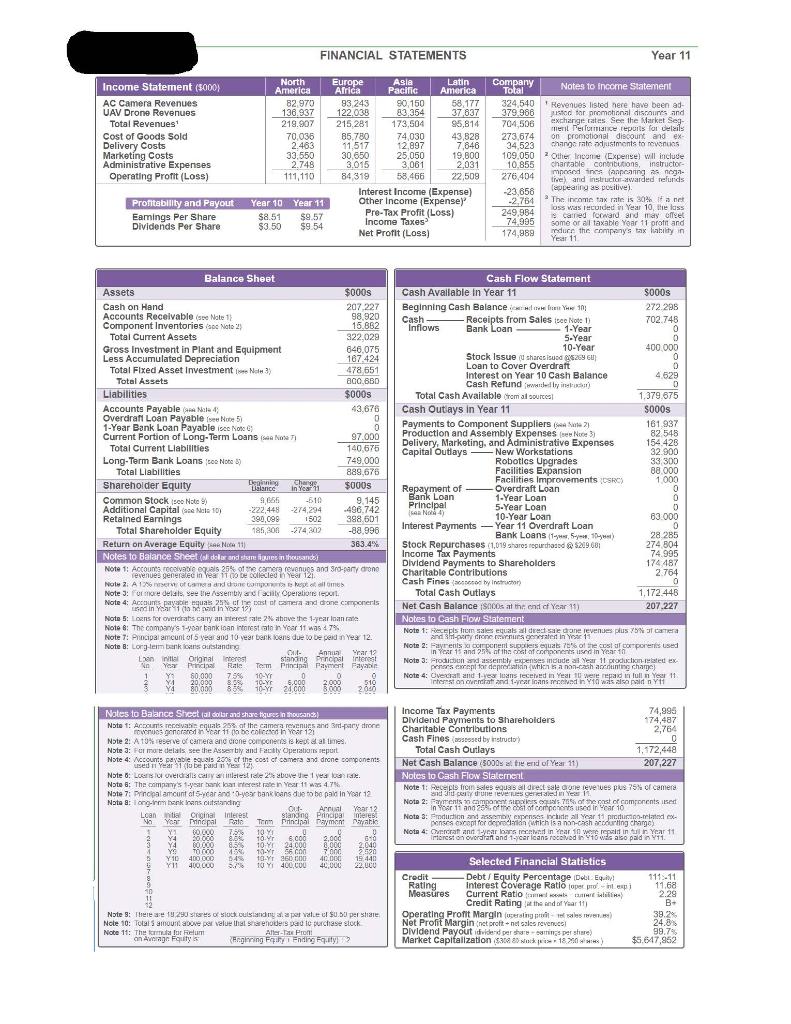
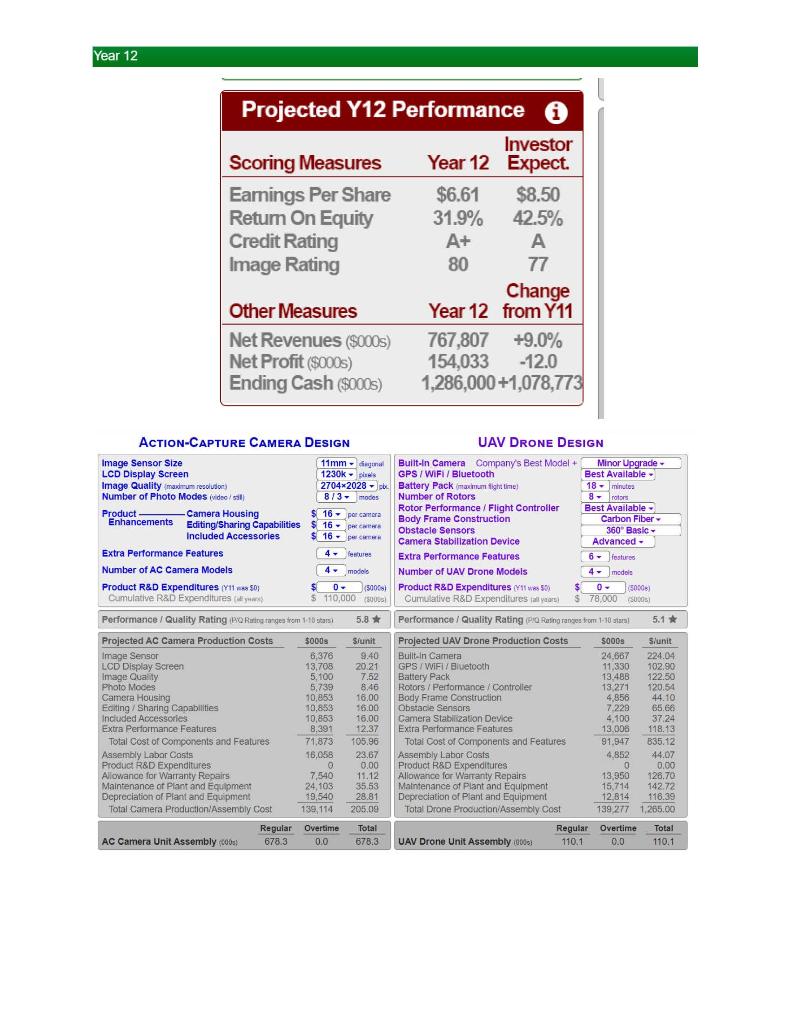
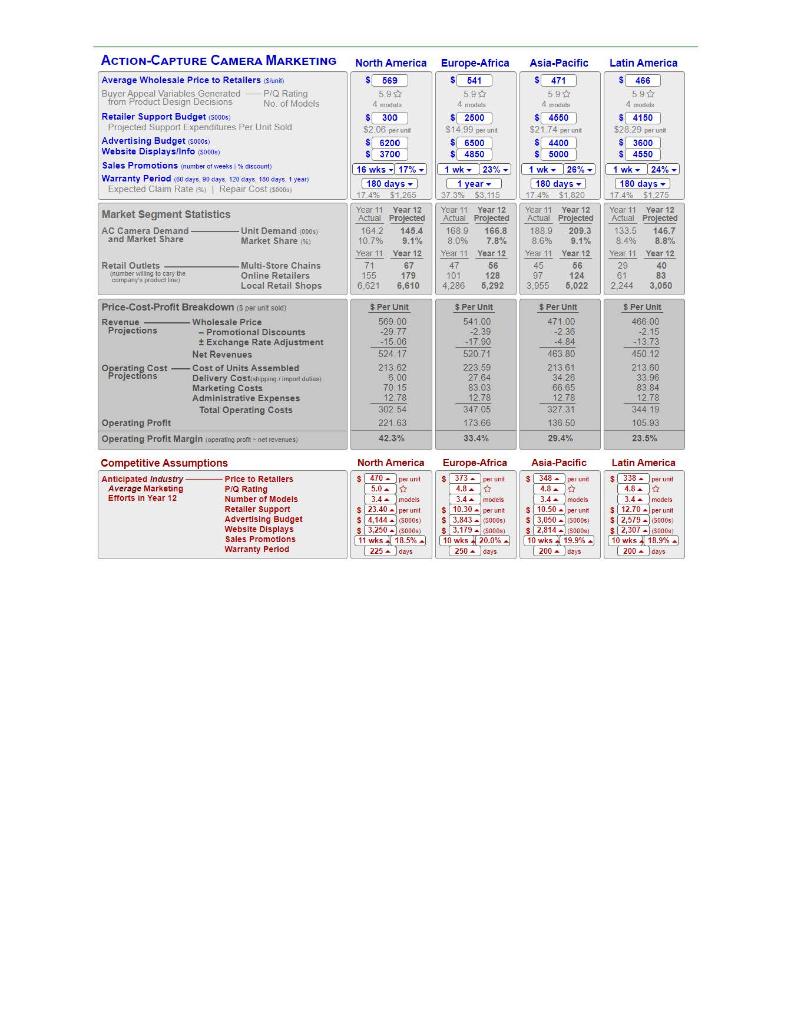
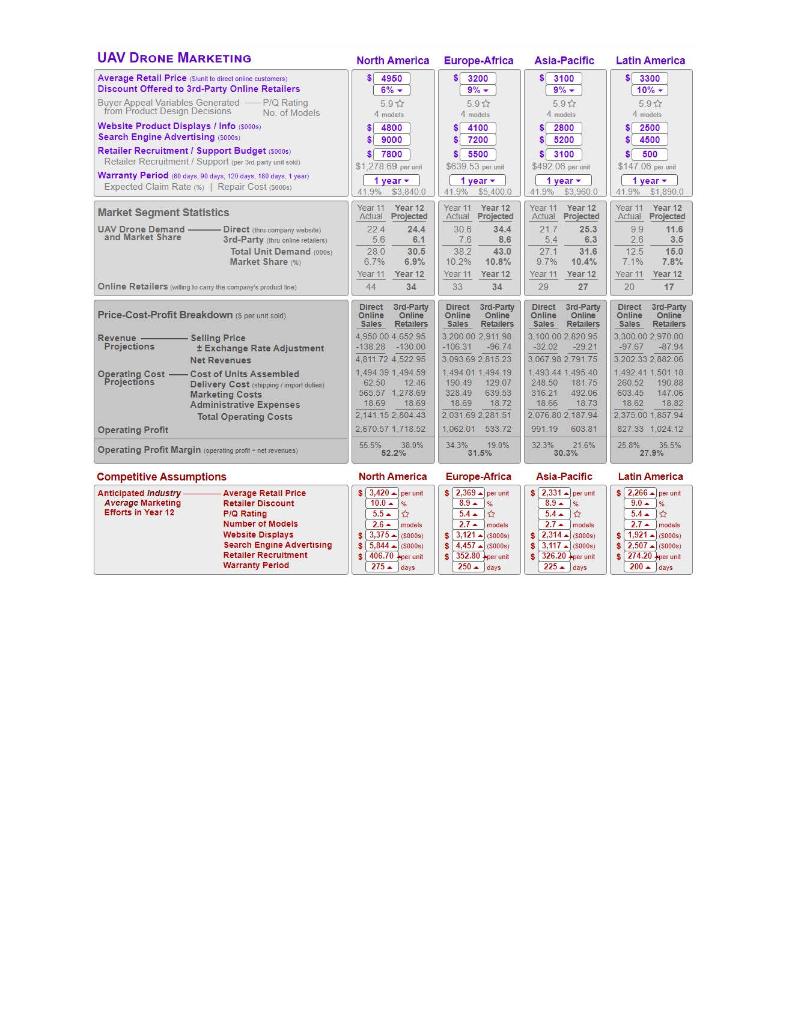
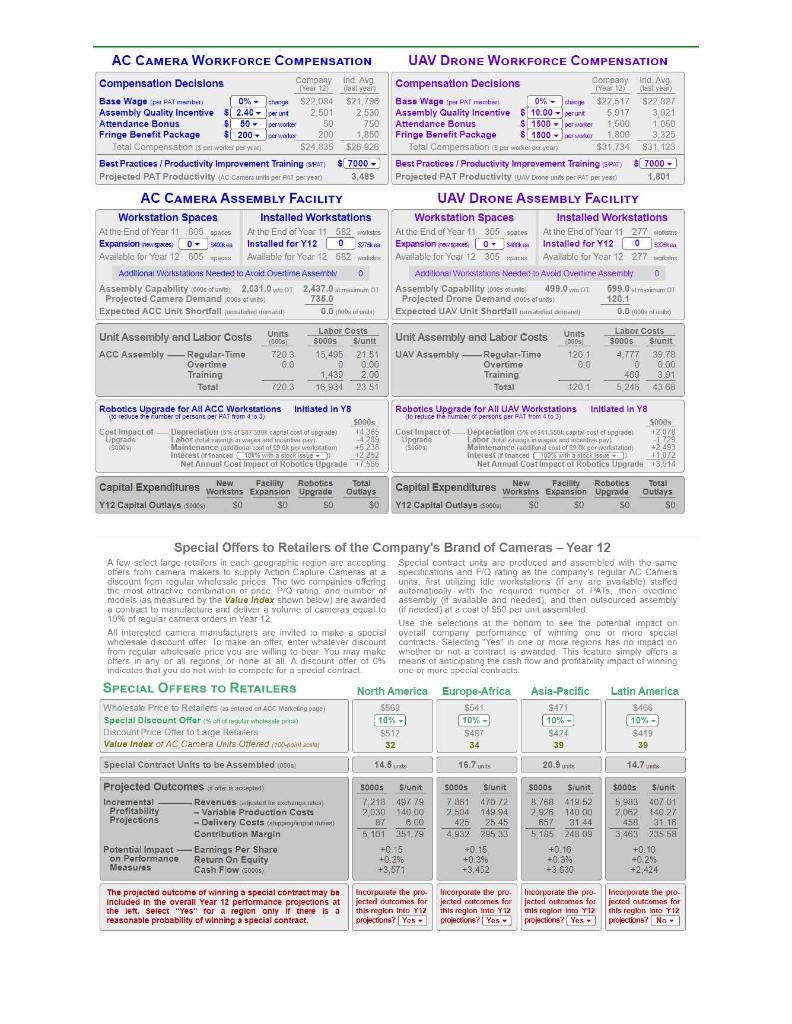
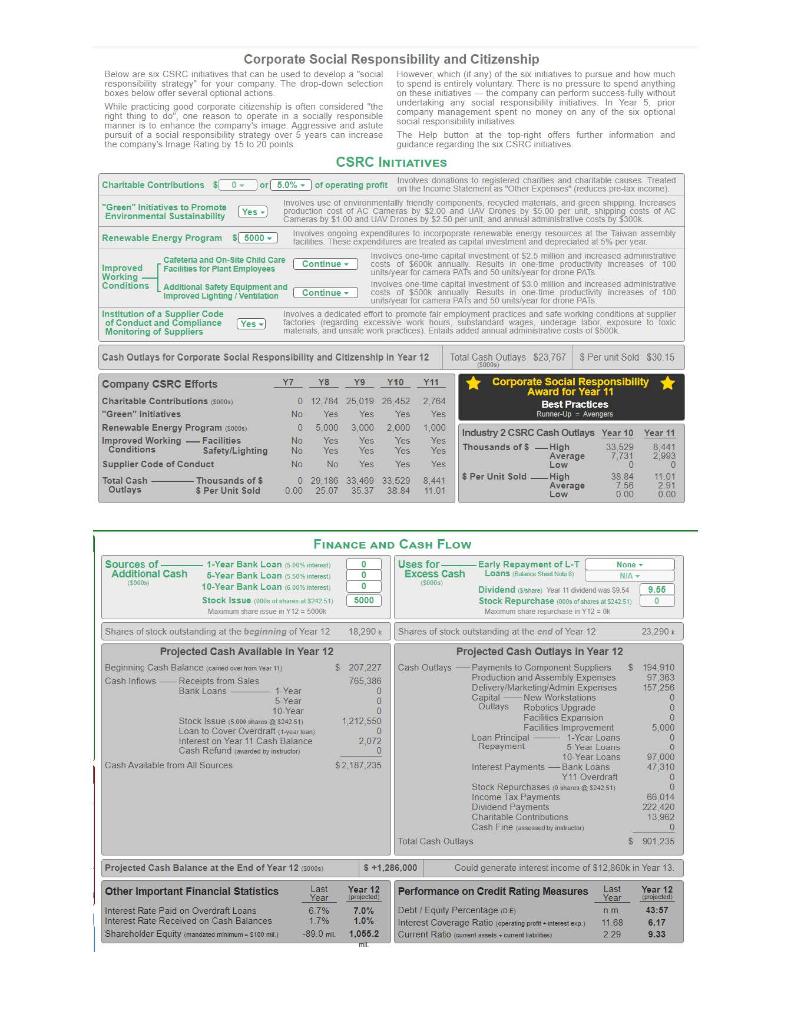
FINANCIAL STATEMENTS Year 11 83.354 Income Statement (5000) AC Camera Revenues UAV Drone Revenues Total Revenues Cost of Goods Sold Delivery Costs Marketing Costs Administrative Expenses Operating Profit (Loss) North America 82.970 136.937 219.907 70,036 2.463 33.550 2.748 111,110 Europe Asia Latin Africa Pacific America 83,243 90,150 58.177 122.038 37 837 215,281 173,504 85,814 85.780 74,030 11,517 43,528 12,897 7,846 30.650 25.050 19,600 3.015 3,061 2,031 84,319 58,466 22,509 Interest Income (Expense) Other Income (Expense) Pre-Tax Profit (Loss) Income Taxes Net Profit (Loss) Company Total Notes to income Statement 324 540 Revenues listed here have been 379.966 stod for promotional discours and 704,506 exchange rates See the Market Seg- 273 674 on promotional discount and ex- 34,523 change rate ajustments to revenues 109.050 2 Other Income (Expense) will include 10,855 chartable contributions, instructor mposed non ancang angin 276,404 tive and instructor awarded refurds 23,656 appearing as positive) -2.764 The income tax rate is 30% a net US Was Tecided Year 10, te loss 249,984 cained forward and may offeet 74.995 some or al taxable Year 11 profit and 174,989 reduce the company's tax liability Year 11 Profitability and Payout Eamings Per Share Dividends Per Share Year 10 Year 11 $8.51 $9.57 $3.50 $9 54 Balance Sheet Assets $000s Cash on Hand 207.227 Accounts Receivable e Nate 1) 98.920 Component Inventories (ope Note 15.852 Total Current Assets 322,029 Gross Investment in Plant and Equipment 646.075 Less Accumulated Depreciation 167.424 Total Fixed Asset investment is de 3) 478 651 Total Assets ac0.680 Liabilities $000s Accounts Payable 43.676 Overdraft Loan Payable No 5) 0 1-Year Bank Loan Payable sec Noc 0 Current Portion of Long-Term Loans 97.000 Total Current Liabilities 140.675 Long-Term Bank Loans Note B) 749.000 Total Liabilities 889,676 Shareholder Equity Degtig Charge Lalance In Year $000s $ Common Stocks Note) 9,655 -510 9.145 Additional Capital sa Nel 10) -222,448 -274,294 -496.742 Retained Earnings 390,099 1502 398,601 Total Shareholder Equity 185,808 -974302 -88.996 Return on Average Equity sex 111 363.4% Notes to Balance Sheet (al dolor and strategies in thousand Note 1: Accounts receivable egals 25% of the camera revenues and 3rd-party drone revenues generated in Year 1100 collected Year 121. Note 2. A 126 of me and doctor hoe om Note 3: For more detais see e resembly of city Operations legal Note 4: Accounts payable quals 25 che cost of camera and drone componeris and in Year 1 to be in Year 12 Note 5: Loans for overdrats carry anterest rate 2 above the 1-year loan rate Note 8: The company's yar tank loan interest rate in Year 11 was 47% Note 7: Procipal amount of 5 year and 10 year berkens due to be perd Yex 12. Note 8: Long-term bankans outstanding CU Anna Year 12 Loan initial Original interest standing Principal interest No Year cal Rale Team Principal Payment Paya 1 Y 50.000 7.5% 10-Y 0 YA 20.000 8.68 16-Y YA 80.000 854 10-Y 24.CO 2018 Cash Flow Statement Cash Available in Year 11 S000s Beginning Cash Balance.com BoY 10 272295 Cash -Receipts from Sales year see 702.748 Inflows Bank Loan 1 5-Year 0 10-Year 400 000 Stock Issue sharesisud 829) 0 Loan to Cover Overdraft 0 Interest on Year 10 Cash Balance 4.629 Cash Refund werden we Total Cash Available from all sources 1.379.675 Cash Outays in Year 11 S000s Payments to Component Suppliers (2) 161 937 Production and Assembly Expenses. No 3 82 548 Delivery, Marketing, and Administrative Expenses 154 428 Capital Outlays New Workstations 32.900 Robotics Upgrades 33 300 Facilities Expansion 88.000 Facilities Improvements SRO 1000 Repayment of Overdraft Loan 0 Bank Loan 1-Year Loan 0 Principal 5-Year Loan 0 SAN N4 10-Year Loan Interest Payments Year 11 Overdraft Loan 3 Bank Loans 15- yet) 28 285 Stock Repurchases (1,019 shares repurchased $209681 274 804 Income Tax Payments 74.995 Dividend Payments to Shareholders 174487 Charitable contributions 2.764 Cash Fines by in 0 Total Cash Outlays 1.172.446 Net Cash Balance Sacos at the end of Year 11) 207.227 Notes to Cash Flow Statement Note 1: Recep Ten sales equals al dred sale dane revenues plus 75% cara and si-carty drone rernes generater in Your Note 2: Parents acarponen suggles quals 70% of the cost al corporents used in Year 15 and 2 of the coat of components used in Year 10 Note 3: Prodloun and assembly expenses include al Year 1 producin-rested ex. personen for depresin which is a non-charning chame Note 4: Overall and 1 year loans received in Year 1 were repa full Year 11 Trest on aratand 1-year loans Trendin Yin was also paid nyt1 63.000 5.000 2,764 Notes to Balance Sheetal dollar and share figures in thousan) Note 1: Acous receivaba quals 20 at the camera revenues and 3rd pary drone nues generandan Year 11 9 be coliesen In Year 121 Note 2: A 10% reserve of camera and crone components is het date Note 3: For more delal see the Assembly and Facily Operationis report Note 4: Nccounts payable quals 23 ct the cost of camera and drone components used TI Year 1 (to be paid in Yes 123 Note 6: Loveldicalsystestide above de 1 year Note 8: The companys 1-year bank at interest rate In Year 11 was 4.7% Note 7: Principal amount of 5-year and o-year bankans due to be paid In Year 12 Note 8: long- rankrans outstanding Out- Art Year 12 Loan orginal Interest standing Principalmeres. No Year Principal Tom Principal Paymem paratie Y 0 209 10 YI Y4 20.000 8.68 10. 60 YA 81546 $0.999 10-Y 24 000 8.000 2,040 YS 1840 17-Y 56 00 ond Y10 400 000 249 100 40.000 19.441 Y11 400.000 3." 10 Y1 400,COU 40,000 22,000 Income Tax Payments 74.995 Dividend Payments to Shareholders 174,487 Charitable Contributions Cash Finessed by instructor 0 Total Cash Outlays 1,172,448 Net Cash Balance (5000s the end of Year 11) 207,227 Notes to Cash Flow Slaternent Note 1: Receipts from les quas al direct sale cone leve wes plus 75% of camera and certy de revenues de les Note 2: Parents to component stages. 7. fenst of components et In Year 11 and 25% of the of components used in Year 10 Note 3: Production and Spenses chart all Year 11 produtorated ex- penses except for deprecarion which is a non-cash accounting change) Note 4 Overcraft and 1 year and received in Year in were repair in Year 11 Horst on overdraft and 1-ycaricans rolved in 910 was also paldin 411 2.00 Selected Financial Statistics Credit Debt / Equity Percentage Doll Equi 111-11 Rating Interest Coverage Ratio operohepi 11.68 Measures Current Ratio 2.29 Credit Rating at the end of Year 11 B- Operating Profit Margin sering tease) 39.2 Net Profit Margin(net proftnet sales revenus 24.8 Dividend Payout dividend persecamins per shure) 99.7 Market Capitalization 32 8. 1820) $5,647,962 Note 3: There are 19290es of such outstanding at a petvalec Sub per share Nole 10: Total amount above per value thelaenoides paid to purchase stock Note 11: Thetforum Aller Prom an average Fauty Frigining Fry Ending Equity Year 12 Projected Y12 Performance Investor Scoring Measures Year 12 Expect. Earnings Per Share $6.61 $8.50 Retum On Equity 31.9% 42.5% Credit Rating A+ A Image Rating 80 77 Change Other Measures Year 12 from Y11 Net Revenues (5000s) 767,807 +9.0% Net Profit ($000s) 154,033 -12.0 Ending Cash ($000) 1,286,000+1,078,773 4 - modelis ACTION-CAPTURE CAMERA DESIGN UAV DRONE DESIGN Image Sensor Size 11mm - Built-In Camera Company's Best Model + Minor Upgrade LCD Display Screen 1230k GPS / WiFi / Bluetooth Best Available Image Quality main rollo 27042028 Battery Pack (maximum fight time 18 minutes Number of Photo Modes (video) 8/3 - modes Number of Rotors 8. rators Product Camera Housing $ 16 porc Rotor Performance / Flight Controller Best Available Enhancements Editing/Sharing Capabilities $ 16. p* Body Frame Construction Carbon Fiber Obstacle Sensors 360 Basic Included Accessories $ 16 - Camera Stabilization Device Advanced Extra Performance Features 4. Centure Extra Performance Features 6. festures Number of AC Camera Models 4 model Number of UAV Drone Models Product R&D Expenditures ( 1501 D- (3000 Product R&D Expenditures Yes $ 0 (5000) Cumulative R&D Expenditures $ 110,000 Cumulative R&D Expenditures altas) $ 78.000000 Performance / Quality Rating Ringtones from 1:10 stars 5.8 * Performance / Quality Rating po Rating ranges from 1-10 5.1 Projected AC Camera Production Costs $000s Sunit Projected UAV Drone Production Costs 5000s Slunit Image Sensor 8,376 9.40 Built-In Camera 24,667 224.04 LCD Display Screen 13,708 20.21 GPS / WIFI/ Bluetooth 11,330 102.90 Image Quality 5,100 7.52 Battery Pack 13.488 122.50 Photo Modes 5,739 8.46 Rotors / Performance Controller 13,271 120.54 Camera Housing 10,853 16.00 Body Frame Construction 4,856 44.10 Editing/Sharing Capabilities 10,853 16.00 Obstacle Sensors 7.229 65.66 Included Accessories 10,853 16,00 Camera Stabilization Device 4,100 37.24 Extra Performance Features 8.391 12.37 Extra Performance Features 13.008 118.13 Total Cost of Components and Features 71,873 105.96 Total Cost of Components and Features 91,947 B35.12 Assembly Labor Costs 16,05 23,67 Assembly Labor Costs 4,852 44.07 Product R&D Expenditures 0.00 Product R&D Expenditures 0 0.00 Allowance for Warranty Repairs 7,540 11.12 Allowance for Warranty Repairs 13,950 128.70 Maintenance of Plant and Equipment 24,103 35.53 Maintenance of Plant and Equipment 15,714 142.72 Depreciation of Plant and Equipment 19,540 Depreciation of Plant and Equipment 12.814 116.39 Total Camera Production/Assembly Cost 139, 114 205.09 Total Drone Production/Assembly Cost 139 277 1,265.00 Regular Overtime Total Regular Overtime Total AC Camera Unit Assembly (6) 678.3 0.0 678.3 UAV Drone Unit Assembly od 110,1 0.0 110.1 28.81 North America Europe-Africa $ 569 $ 541 5.9 59 Latin America $ 466 59 PIQ Rating ACTION-CAPTURE CAMERA MARKETING Average Wholesale Price to Retailers Sunti Buyer Appeal Variables Generated from Product Design Decisions No. of Models Retailer Support Budget 5000 Projected Support xpenditures Per Unit Sold Advertising Budget (5000) Website Displays/Info (0) Sales Promotions number of works count Warranty period day cay 120 clay 180 day 1 year Expected Claim Rate Repair Cost 5500 $ 300 $206 perant $ 6200 $ 3700 16 wks -17% 180 days 17 49 51 265 Year 11 Year 12 Actual Projected 164.2 145.4 10.7% 9.1% Year 11 Year 12 71 67 155 179 G.621 6.610 $ 2800 $14 99 petunt $ 6500 $ 4850 1 wk - 23% 1 year 37:32 $3115 Year 11 Year 12 Actual Projected 168 9 166.8 8.0% 7.8% Year 11 Year 12 47 56 101 128 4,286 6,292 Asia-Pacific $ 471 594 4 $ 4660 $21 74 $ 4400 $ 5000 1 wk - 26% 180 days 174% $1.820 Year 11 Year 12 Actual Projected 188.9 209.3 8.6% 9.1% Yess 11 Year 12 45 66 97 124 3,055 5.022 $4150 $28.29 perut $ 3600 $ 4550 1 wk. 24% 180 days 17.4% 51.275 Year 11 Year 12 Actual Projected 133,5 146.7 8.4% 8.8% Year 11 Year 12 29 40 61 83 2.244 3,050 Market Segment Statistics AC Camera Demand and Market Share Unit Demand os Market Share IN Retail Outlets sumber wing to cary the Sauce Multi-Store Chains Online Retailers Local Retail Shops Price-Cost-Profit Breakdown (parunt sole Revenue Wholesale Price Projections - Promotional Discounts Exchange Rate Adjustment Net Revenues Operating Cost Cost of Units Assembled Projections Delivery Costud Marketing Costs Administrative Expenses Total Operating costs Operating Profit Operating Profit Margin operating promet revenues $ Per Unit 569.00 -29.77 -15.06 524 17 213.62 5.00 70.15 12.78 302 54 221 63 42.3% $ Per Unit 541.00 -2.39 -17.90 520.71 223.59 27 64 83.03 12.78 347 05 173.66 33.4% $ Per Unit 471.00 -2 38 -4.84 163.80 213.61 34 20 66 65 1278 S Per Unit 466.00 -2.15 -13.73 450 12 213.60 33.96 83.84 12.78 344 19 105.93 23.5% 327 31 136 50 29.4% Competitive Assumptions Anticipated industry Price to Retallers Average Marketing PIQ Rating Efforts in Year 12 Number of Models Retailer Support Advertising Budget Website Displays Sales Promotions Warranty Period North America $1470 punt 5.02 3.4. models $23.40 unit $ 4,144 (SDG) s 3.250.300) 11 wks 18.5% 225 days Europa-Africa $ 373 14.8 3.4. models $10.30 per $ 3.843 000) $ 3.179.000 10 wks 20.0% 250 days Asia-Pacific 31 348 4.8 3.4 - Models $10.50 per $3,050.000 $12,8140 10 wks 19.9% 2003 Latin America 3338. 4.8.2 3.4. models $12.70 per unit $12.075.000 $ 12,307 800 10 wks 18.9% 1200 days Latin America Asia-Pacific S 3100 9% 9% UAV DRONE MARKETING Average Retail Price Sant to directonine customers Discount Offered to 3rd-Party Online Retailers Buyer Appeal Variables Generated P/Q Rating from Product Design Decisions No. of Models Website Product Displays / Info 500 Search Engine Advertising soods Retailer Recruitment / Support Budget soos Retailer Recruitment/Support per party into Warranty period od 120 cm 180dw tym Expected Claim Rate Repair Cost 3000) North America Europe Africa $ 4950 $3200 6% 597 5.91 male 4 models $ 4800 $ 4100 $ 9000 $ 7200 $ 7800 $ 5500 $1,278 89 $83953 1 year 1 year 61.99 $3.840.0 41.996 SX400) Year 11 Year 12 Year 11 Year 12 Actual Projected Achal Projected 224 24.4 30.6 34.4 5.6 6.1 76 8.6 280 30.5 38.2 43.0 6.79 6.9% 10 298 10.8% Year 11 Year 12 Year 11 Year 12 44 34 33 34 5.972 odels $ 2800 $ 5200 $ 3100 $492 08 1 year 41.9%$3.950.0 Year 11 Year 12 Actual Projected 217 25.3 5.4 6.3 27.1 31.6 9.7% 10.4% Year 11 Year 12 29 27 $ 3300 10% 59 1 $ 2500 $ 4500 $ 500 $14708 1 1 year 41.9% 51 990.0 Year 11 Year 12 Achial Projected 9.9 11.6 2.8 3.5 12.5 15.0 7.8% Year 11 Year 12 20 17 Market Segment Statistics UAV Drone Demand - Directory and Market Share 3rd-Party thru einer Total Unit Demand Market Share 7.1% Online Retailers trip to carry the company which to Price-Cost-Profit Breakdown par un sold) -) Revenue Selling Price Projections + Exchange Rate Adjustment Net Revenues Operating Cost Cost of Units Assembled Projections Delivery Costcode Marketing Costs Administrative Expenses Total Operating Costs Operating Profit Operating Profit Margin operating pet-net severe Direct 3rd-Party Online Online Sales Retailers 4950 00 4 652 95 -138.28 -13000 4,811 72 4 529 95 1.494 39 1.494 59 62.50 12.16 565,67 1 278.69 18,69 1859 2,141.15 2 80443 2.670.57 1.718.52 56.5% 38.096 52.2% Direct 3rd-Party Direct3rd-Party Online Online Online Online Sales Retalers Sales Retailers 320000 2,911,90 3.10000 2.820 95 -106.31 -9674 -3202 -29.21 3093 69 2 615 23 306798 2 791 75 1.49401 149.419 1.493.44 1.495.40 190 49 129.02 248.50 181.75 328 49 539.53 316.21 492.06 18.59 18.72 18.56 18.73 2031.69 2 281.51 2076,802 187.94 1.062.01533.72 901.19 603.81 343% 19:05 32.3% 256% 31.5% 30.3% Direct 3rd-Party Online Online Sales Retailers 3.300.00 2.97000 -97.67 -87.94 3202 33 2842.06 1.492.41 1.501 10 260.52 190.88 503.45 147.06 18.52 18.82 2.375.00 1.857.94 827 33 1.024.12 25.8% 35.5% 27.9% Europe-Africa $ 2,369 per Asia-Pacific $ 2,331 punt | Competitive Assumptions Anticipated industry Average Retail Price Average Marketing Retailer Discount Efforts in Year 12 PIQ Rating Number of Models Website Displays Search Engine Advertising Retailer Recruitment Warranty Period North America $3,420 per 10.0 5.5 26. $13,375.00 35.844.00 51406.70 275 days 5.4. 2.7.me $ 3,121.00 $ 4,457 000 $ 352.80 GR 250 days 5.4 2.7.me $ 2,314-5000 $ 3,117 000 $326.20 henk 225. Jays Latin America $ 2,266 Juwont 9.0.1 5.4 2.7 ms $ 1,921 300 $2,507.00 274.20 W 200. Jos AC CAMERA WORKFORCE COMPENSATION UAV DRONE WORKFORCE COMPENSATION Compensation Decisions Companying Ava Year 121 Castean Compensation Decisions Company ind. Ava Year 12 lal yedi Base Wages PAT 10%- $22084 $21796 Base Wagen PAT 0% - $22,517 822 827 Assembly Quality Incentive $ 2.40 perunt 2.501 2.530 Assembly Quality Incentive $10.00 perut 5.917 3.921 Attendance Bonus $ 50 per worker 50 750 Attendance Bonus $ 1600 per 1,500 1050 Fringe Benefit Package $1 200 - pokus 200 1.850 Fringe Benefit Package $ 1800- 1 800 3.325 Total Compensation per works perem) S24.835 526 926 Total Compensation power year $31.734 $31 123 Best Practices / Productivity Improvement Training SPATI $7000 - Best Practices I Productivity Improvement Training Sest) $7000 - Projected PAT Productivity Ac. Camera units per put per year 3,489 Projected PAT Productivity in Deone units per PAT per year 1,801 AC CAMERA ASSEMBLY FACILITY UAV DRONE ASSEMBLY FACILITY Workstation Spaces Installed Workstations Workstation Spaces Installed Workstations At the End of Year 11 605 At the End of Year 11 582 wote At the End of Year 11 305 soates At the End of Year 11 277 Expansion now faces 0 R Installed for Y12 09 Expansion from 0 SM Installed for Y12 0 BOS Available for Year 12 005 Available for Year 12 582 Available for Year 12 305 Available for Year 12 277 km Additional Workstations Needed to Avoid Overtime Assembly 0 Additional Workstations Needed to Avoid Overtime Assembly 0 Assembly Capability of 2,031.0 OT 2,437.0 mm Assembly Capability of units 499.00 599.00 Projected Camera Demands of units 735.0 Projected Drone Demand 1000s of us 120.1 Expected ACC Unit Shortfall 0.00 Expected UAV Unit Shortfall 0.000 Labor Costs Units Unit Assembly and Labor Costs Labor Costs Units 10005 Unit Assembly and Labor Costs S000s S/unit DOOS S0005 Sunit ACC Assembly Regular-Time 7203 15,495 2151 UAV Assembly UAV Assembly Regular-Time 120.1 4.777 39 78 Overtime 00 0 0.00 Overtime 0.0 0 0.00 Training 1.439 2.00 Training 409 3.91 Total 7203 16 934 23 51 Total 1201 5225 43 68 Robotics Upgrade for All ACC Workstations Initiated in Y8 (reduce the number of persons per FAT from 4. J) $000 Cost Impact of Depreciation of a captal cost of upgrade) +4365 Upgrade -4209 500 Maintenance adidas Ok per wilt om +5 238 Interest financed with a stock issue 12252 Net Annual Cost impact of Robotics Upgrade 17566 Roboties Upgrade for All UAV Workstations Initiated in Ya to reduce the number of persons per PATHM to 5 Soos Cost Impact of Depreciation of 541 50k capital cost ograde Upgrade +2.078 Laborar -1729 Soo Maintenance ancora per restation +2493 Interest in financed was with a locale 1072 Net Annual Cost impact of Robotics Upgrade 3,514 Capital Expenditures workstns Expansion Upgrade New Facility Robotics Y12 Capital Outlays SO $0 SO Total Outlays Capital Expenditures worksns Expansion Upgrade Facility Robotics Y12 Capital Outlays 5800 $0 50 SO Total Outlays SO $0 Special Offers to Retailers of the Company's Brand of Cameras - Year 12 A few select large rctailors in each geographic region are accepting Special contract units are produced and assembled with the same offers from camera makers to supply Action Caplure Cameras at a specifications and P/Q rating as the company's regular AC Camera discount from regular wholesale prices. The two companies offering units first utilizing idle workstations if any are available) staffed the most attractive combinaton of pnce. Po rating and number of automaticaily with the required number of PATS, then overtimo models as measured by the Value Index shown below) are awarded assembly (if available and needed), and then outsourced assembly a contract to manufacture and deliver a volume of cameras equal to if needed) at a cost of $50 per unit assembled 10% of regular camera orders in Year 12 use the selections at the bottom to see the potential impact on All interested carriera manufacturers are invited to make a special overall company performance of winning one or more special wholesale discount offer. To make an offer enter whatever discount contracts Selecting "Yes in one or more regions has no impact on from regular wholesale price you are willing to bear. You may make whether or not a contract is awarded. This feature simply offers a offers in any or all regions or none at all. A discount offer of 0% means of anticipating the cash flow and profitability impact of winning indicates that you do not wish to compete for a special contract one or more special contracts SPECIAL OFFERS TO RETAILERS North America Europe Africa Asia-Pacific Latin America Wholesale Price to Retailers (as entered ca ACC MC De 5569 $541 $471 $466 Special Discount Offer gut we 10% 10% - 10% - 10%) Discount Price Offer to Large Retailers 5512 S487 $424 $439 Value Index of AC Camera Units Offered 32 34 39 39 Special Contract Units to be Assembled 1000) Projected Outcomes ople S0005 SHunit 5000s S Slunit $0005 Slunit 30005 Slunit Incremental Revenues will 7 218 497 79 7851 470 12 8768 419 52 5,983 407.01 Profitability - Variable Production Costs 2,030 140 00 2.504 149 94 2,926 140 00 2,082 140.27 Projections - Delivery Costs 87 6.00 425 25.45 857 31 44 458 3116 Contribution Margin 5 101 351.79 493279533 5.185 248.09 3,463 235.5a Potential Impact Earnings Per Share -0.5 +0.15 +0.16 +0.10 on Performance Return On Equity +0.396 +0.39 +0.3% -0.25 Measures Cash Flow 5000 +3,571 +3.452 -3.630 +2,424 14. ure 16.7 20.9 14.7 The projected outcome of winning a special contract may be Included in the overall Year 12 performance projections at the left. Select "Yes" for a region only if there is a reasonable probability of winning a special contract. incorporate the pro. Incorporate the pro Incorporate the pro. Incorporate the pro jected outcomes for jected outcomes for jected outcomes for jected outcomes for this region Inn Y12 this region Into Y12 this region into YIZ this region into Y12 projections? Yes projections? Yes projections? Yes projections? No Corporate Social Responsibility and Citizenship Below are sx CSRC Initiatives that can be used to develop a "social However which if any) of the six initiatives to pursue and how much responsibility strategy for your company. The drop-down selection to spend is entirely voluntary. There is no pressure to spend anything boxes below offer several optional actions on these initiatives the company can perform successfully without While practicing good corporate citizenship is often considered the undertaking any social responsibility initiatives. In Year 5. prior night thing to do one reason to operate in a socially responsible company management spent no money on any of the six optional manners to enhance the company's image Aggressive and astute Social responsibility initiatives pursuit of a social responsibility strategy over 5 years can increase The Help button at the top right offers further information and the company's Image Rating by 15 to 20 points guidance regarding the six CSRC Initiatives CSRC INITIATIVES Charitable Contributions $0 or 5.0% of operating profil of operating profit on the income Statements Other Expenses (reduces pretax income) Involves donations to registered charities and charitable causer Treated "Green" Initiatives to promote Involves use of onvironmentally friendly components, recycled materials and green shipping increases Environmental Sustainability Yes - production cost of AC Cameras by $2.00 and UAV Drones by 55.00 per unit shipping costs of AC Cameras by $1.00 and UAV Drones by 52 50 per unit and annual administrative costs by Sook Renewable Energy Program S 5000 involves ongoing expenditures to incorporate renewable energy resources at the Taiwan assembly facilities. These expenditures are treated as capital investment and deprecated a 5% per year. Cafeteria and On-Site Child Care Involves one-line capital investment of 525 million and increasco administrat Improved Facilities for Plant Employees Continue costs of $600k annually. Results in one-time productivity increases of 100 Working - units year for camera PATs and 50 unitsiyear for dine PATS Conditions Additional Safety Equipment and Involves one time capital investment of $3.0 million and increased administratie Improved Lighting/Ventilation Continue Co of $ok antically Results in one time productivity increases of 100 unistyear for camera Pasand 50 unitsyear for drone PATS Institution of a Supplier Code involves a dedicated effort to promote fair employment practices and safe working conditions at supplier of Conduct and Compliance Yes factories (tegarding excessive work hours, substandard wages, underage labor exposure to foxic Monitoring of Suppliers materials, and use work practices. Entails added annual adminative costs of $500K Y8 Y TO Yes Cash Outlays for Corporate Social Responsibility and Citizenship In Year 12 Total Cash Outiays $23,767 $ Perunt Sold $30.15 50009 Company CSRC Efforts Y7 Y9 Y11 Corporate Social Responsibility Award for Year 11 Charitable Contributions ) 0 12 784 25019 26 452 2.764 Best Practices "Green" Initiatives No Yes Yes Yes Runner-Up = Avengers Renewable Energy Program (1000) 05.000 5.000 3.000 2000 1,000 Industry 2 CSRC Cash Outlays Year 10 Year 11 Improved Working Facilities No Yes Yes Yes Conditions Safety/Lighting No Yes Yes Yos Yes Thousands of $ High 33 529 3, 441 Average 7.731 2,993 Supplier Code of Conduct NO NO Yes Yes Low 0 0 Total Cash - Thousands of 0 20 186 33.400 33.529 8,441 $ Per Unit Sold High 39.84 11.01 758 Outlays 0.00 2507 35.37 38.84 291 Average $ Per Unit Sold 11.01 Low 0.00 0 Yes Yes FINANCE AND CASH FLOW Sources of Additional Cash 500 1-Year Bank Loan 5-Year Bank Loan interest 10-Year Bank Loan (600 rest Stock Issue (251) Maximum share issue Y12 = 5000 0 0 0 5000 Uses for Excess Cash S600 Early Repayment of L-T None Loans NIA Dividende o 11 dividend w $9.54 Stock Repurchase 1000 of shares 5242 51) Memum har redan Y12 = 0 9.56 0 23 290 Shares of slock outstanding at the beginning of Year 2 18,290 Projected Cash Available in Year 12 Begiting Cash Balance cover von Wat $207,227 Cash Inflows Receipts from Sales 765 386 Bank Loans 1 Year 0 5 Year 0 10 Year 0 Stock Issue 5.000 a 5942511 1.212.550 Loan to Cover Overdraft cty Interest on Year 11 Cash Balance 2072 Cash Refund made by instructor 0 Cash Available from All Sources $2187 235 Shares of stock outstanding at the end of Year 12 Projected Cash Outlays in Year 12 Cash Outlays Payments to Component Suppliers Production and Assembly Expenses Delivery Marketing Admin Expenses Capital New Workstations Dulbays Robotics Upgrade Facilities Expansion Facilities Improvement Loan Principal1-Year Loans Repayment 6 Yea: Luis 10 Year Loans Interest Payments -Bank Loans Y11 Overdraft Stock Repurchases wham $142515 Income Tax Payments Dividend Payments Charitable Contributions Cash Fine Total Cash Outlays $ 194 910 97.363 157 256 0 0 0 5.000 0 0 97000 47310 0 0 66 014 222 420 13 962 0 $ 901.236 $ +1.286.000 Could generate interest income of $12.860k in Year 13. Projected Cash Balance at the End of Year 12 5000) Other Important Financial Statistics Last Year Interest Rate Paid on Overdraft Loans 6.7% Interest Rate Received on Cash Balances 1.7% Shareholder Equity and minimum - St. -89.0 ml Year 12 7.0% 1.0% 1.065.2 Performance on Credit Rating Measures Debt/Equity Percentage DE Interest Coverage Ratio ispering protest Current Ratio was create Last Year num 1188 2.29 Year 12 coded 43:57 6.17 9.33 FINANCIAL STATEMENTS Year 11 83.354 Income Statement (5000) AC Camera Revenues UAV Drone Revenues Total Revenues Cost of Goods Sold Delivery Costs Marketing Costs Administrative Expenses Operating Profit (Loss) North America 82.970 136.937 219.907 70,036 2.463 33.550 2.748 111,110 Europe Asia Latin Africa Pacific America 83,243 90,150 58.177 122.038 37 837 215,281 173,504 85,814 85.780 74,030 11,517 43,528 12,897 7,846 30.650 25.050 19,600 3.015 3,061 2,031 84,319 58,466 22,509 Interest Income (Expense) Other Income (Expense) Pre-Tax Profit (Loss) Income Taxes Net Profit (Loss) Company Total Notes to income Statement 324 540 Revenues listed here have been 379.966 stod for promotional discours and 704,506 exchange rates See the Market Seg- 273 674 on promotional discount and ex- 34,523 change rate ajustments to revenues 109.050 2 Other Income (Expense) will include 10,855 chartable contributions, instructor mposed non ancang angin 276,404 tive and instructor awarded refurds 23,656 appearing as positive) -2.764 The income tax rate is 30% a net US Was Tecided Year 10, te loss 249,984 cained forward and may offeet 74.995 some or al taxable Year 11 profit and 174,989 reduce the company's tax liability Year 11 Profitability and Payout Eamings Per Share Dividends Per Share Year 10 Year 11 $8.51 $9.57 $3.50 $9 54 Balance Sheet Assets $000s Cash on Hand 207.227 Accounts Receivable e Nate 1) 98.920 Component Inventories (ope Note 15.852 Total Current Assets 322,029 Gross Investment in Plant and Equipment 646.075 Less Accumulated Depreciation 167.424 Total Fixed Asset investment is de 3) 478 651 Total Assets ac0.680 Liabilities $000s Accounts Payable 43.676 Overdraft Loan Payable No 5) 0 1-Year Bank Loan Payable sec Noc 0 Current Portion of Long-Term Loans 97.000 Total Current Liabilities 140.675 Long-Term Bank Loans Note B) 749.000 Total Liabilities 889,676 Shareholder Equity Degtig Charge Lalance In Year $000s $ Common Stocks Note) 9,655 -510 9.145 Additional Capital sa Nel 10) -222,448 -274,294 -496.742 Retained Earnings 390,099 1502 398,601 Total Shareholder Equity 185,808 -974302 -88.996 Return on Average Equity sex 111 363.4% Notes to Balance Sheet (al dolor and strategies in thousand Note 1: Accounts receivable egals 25% of the camera revenues and 3rd-party drone revenues generated in Year 1100 collected Year 121. Note 2. A 126 of me and doctor hoe om Note 3: For more detais see e resembly of city Operations legal Note 4: Accounts payable quals 25 che cost of camera and drone componeris and in Year 1 to be in Year 12 Note 5: Loans for overdrats carry anterest rate 2 above the 1-year loan rate Note 8: The company's yar tank loan interest rate in Year 11 was 47% Note 7: Procipal amount of 5 year and 10 year berkens due to be perd Yex 12. Note 8: Long-term bankans outstanding CU Anna Year 12 Loan initial Original interest standing Principal interest No Year cal Rale Team Principal Payment Paya 1 Y 50.000 7.5% 10-Y 0 YA 20.000 8.68 16-Y YA 80.000 854 10-Y 24.CO 2018 Cash Flow Statement Cash Available in Year 11 S000s Beginning Cash Balance.com BoY 10 272295 Cash -Receipts from Sales year see 702.748 Inflows Bank Loan 1 5-Year 0 10-Year 400 000 Stock Issue sharesisud 829) 0 Loan to Cover Overdraft 0 Interest on Year 10 Cash Balance 4.629 Cash Refund werden we Total Cash Available from all sources 1.379.675 Cash Outays in Year 11 S000s Payments to Component Suppliers (2) 161 937 Production and Assembly Expenses. No 3 82 548 Delivery, Marketing, and Administrative Expenses 154 428 Capital Outlays New Workstations 32.900 Robotics Upgrades 33 300 Facilities Expansion 88.000 Facilities Improvements SRO 1000 Repayment of Overdraft Loan 0 Bank Loan 1-Year Loan 0 Principal 5-Year Loan 0 SAN N4 10-Year Loan Interest Payments Year 11 Overdraft Loan 3 Bank Loans 15- yet) 28 285 Stock Repurchases (1,019 shares repurchased $209681 274 804 Income Tax Payments 74.995 Dividend Payments to Shareholders 174487 Charitable contributions 2.764 Cash Fines by in 0 Total Cash Outlays 1.172.446 Net Cash Balance Sacos at the end of Year 11) 207.227 Notes to Cash Flow Statement Note 1: Recep Ten sales equals al dred sale dane revenues plus 75% cara and si-carty drone rernes generater in Your Note 2: Parents acarponen suggles quals 70% of the cost al corporents used in Year 15 and 2 of the coat of components used in Year 10 Note 3: Prodloun and assembly expenses include al Year 1 producin-rested ex. personen for depresin which is a non-charning chame Note 4: Overall and 1 year loans received in Year 1 were repa full Year 11 Trest on aratand 1-year loans Trendin Yin was also paid nyt1 63.000 5.000 2,764 Notes to Balance Sheetal dollar and share figures in thousan) Note 1: Acous receivaba quals 20 at the camera revenues and 3rd pary drone nues generandan Year 11 9 be coliesen In Year 121 Note 2: A 10% reserve of camera and crone components is het date Note 3: For more delal see the Assembly and Facily Operationis report Note 4: Nccounts payable quals 23 ct the cost of camera and drone components used TI Year 1 (to be paid in Yes 123 Note 6: Loveldicalsystestide above de 1 year Note 8: The companys 1-year bank at interest rate In Year 11 was 4.7% Note 7: Principal amount of 5-year and o-year bankans due to be paid In Year 12 Note 8: long- rankrans outstanding Out- Art Year 12 Loan orginal Interest standing Principalmeres. No Year Principal Tom Principal Paymem paratie Y 0 209 10 YI Y4 20.000 8.68 10. 60 YA 81546 $0.999 10-Y 24 000 8.000 2,040 YS 1840 17-Y 56 00 ond Y10 400 000 249 100 40.000 19.441 Y11 400.000 3." 10 Y1 400,COU 40,000 22,000 Income Tax Payments 74.995 Dividend Payments to Shareholders 174,487 Charitable Contributions Cash Finessed by instructor 0 Total Cash Outlays 1,172,448 Net Cash Balance (5000s the end of Year 11) 207,227 Notes to Cash Flow Slaternent Note 1: Receipts from les quas al direct sale cone leve wes plus 75% of camera and certy de revenues de les Note 2: Parents to component stages. 7. fenst of components et In Year 11 and 25% of the of components used in Year 10 Note 3: Production and Spenses chart all Year 11 produtorated ex- penses except for deprecarion which is a non-cash accounting change) Note 4 Overcraft and 1 year and received in Year in were repair in Year 11 Horst on overdraft and 1-ycaricans rolved in 910 was also paldin 411 2.00 Selected Financial Statistics Credit Debt / Equity Percentage Doll Equi 111-11 Rating Interest Coverage Ratio operohepi 11.68 Measures Current Ratio 2.29 Credit Rating at the end of Year 11 B- Operating Profit Margin sering tease) 39.2 Net Profit Margin(net proftnet sales revenus 24.8 Dividend Payout dividend persecamins per shure) 99.7 Market Capitalization 32 8. 1820) $5,647,962 Note 3: There are 19290es of such outstanding at a petvalec Sub per share Nole 10: Total amount above per value thelaenoides paid to purchase stock Note 11: Thetforum Aller Prom an average Fauty Frigining Fry Ending Equity Year 12 Projected Y12 Performance Investor Scoring Measures Year 12 Expect. Earnings Per Share $6.61 $8.50 Retum On Equity 31.9% 42.5% Credit Rating A+ A Image Rating 80 77 Change Other Measures Year 12 from Y11 Net Revenues (5000s) 767,807 +9.0% Net Profit ($000s) 154,033 -12.0 Ending Cash ($000) 1,286,000+1,078,773 4 - modelis ACTION-CAPTURE CAMERA DESIGN UAV DRONE DESIGN Image Sensor Size 11mm - Built-In Camera Company's Best Model + Minor Upgrade LCD Display Screen 1230k GPS / WiFi / Bluetooth Best Available Image Quality main rollo 27042028 Battery Pack (maximum fight time 18 minutes Number of Photo Modes (video) 8/3 - modes Number of Rotors 8. rators Product Camera Housing $ 16 porc Rotor Performance / Flight Controller Best Available Enhancements Editing/Sharing Capabilities $ 16. p* Body Frame Construction Carbon Fiber Obstacle Sensors 360 Basic Included Accessories $ 16 - Camera Stabilization Device Advanced Extra Performance Features 4. Centure Extra Performance Features 6. festures Number of AC Camera Models 4 model Number of UAV Drone Models Product R&D Expenditures ( 1501 D- (3000 Product R&D Expenditures Yes $ 0 (5000) Cumulative R&D Expenditures $ 110,000 Cumulative R&D Expenditures altas) $ 78.000000 Performance / Quality Rating Ringtones from 1:10 stars 5.8 * Performance / Quality Rating po Rating ranges from 1-10 5.1 Projected AC Camera Production Costs $000s Sunit Projected UAV Drone Production Costs 5000s Slunit Image Sensor 8,376 9.40 Built-In Camera 24,667 224.04 LCD Display Screen 13,708 20.21 GPS / WIFI/ Bluetooth 11,330 102.90 Image Quality 5,100 7.52 Battery Pack 13.488 122.50 Photo Modes 5,739 8.46 Rotors / Performance Controller 13,271 120.54 Camera Housing 10,853 16.00 Body Frame Construction 4,856 44.10 Editing/Sharing Capabilities 10,853 16.00 Obstacle Sensors 7.229 65.66 Included Accessories 10,853 16,00 Camera Stabilization Device 4,100 37.24 Extra Performance Features 8.391 12.37 Extra Performance Features 13.008 118.13 Total Cost of Components and Features 71,873 105.96 Total Cost of Components and Features 91,947 B35.12 Assembly Labor Costs 16,05 23,67 Assembly Labor Costs 4,852 44.07 Product R&D Expenditures 0.00 Product R&D Expenditures 0 0.00 Allowance for Warranty Repairs 7,540 11.12 Allowance for Warranty Repairs 13,950 128.70 Maintenance of Plant and Equipment 24,103 35.53 Maintenance of Plant and Equipment 15,714 142.72 Depreciation of Plant and Equipment 19,540 Depreciation of Plant and Equipment 12.814 116.39 Total Camera Production/Assembly Cost 139, 114 205.09 Total Drone Production/Assembly Cost 139 277 1,265.00 Regular Overtime Total Regular Overtime Total AC Camera Unit Assembly (6) 678.3 0.0 678.3 UAV Drone Unit Assembly od 110,1 0.0 110.1 28.81 North America Europe-Africa $ 569 $ 541 5.9 59 Latin America $ 466 59 PIQ Rating ACTION-CAPTURE CAMERA MARKETING Average Wholesale Price to Retailers Sunti Buyer Appeal Variables Generated from Product Design Decisions No. of Models Retailer Support Budget 5000 Projected Support xpenditures Per Unit Sold Advertising Budget (5000) Website Displays/Info (0) Sales Promotions number of works count Warranty period day cay 120 clay 180 day 1 year Expected Claim Rate Repair Cost 5500 $ 300 $206 perant $ 6200 $ 3700 16 wks -17% 180 days 17 49 51 265 Year 11 Year 12 Actual Projected 164.2 145.4 10.7% 9.1% Year 11 Year 12 71 67 155 179 G.621 6.610 $ 2800 $14 99 petunt $ 6500 $ 4850 1 wk - 23% 1 year 37:32 $3115 Year 11 Year 12 Actual Projected 168 9 166.8 8.0% 7.8% Year 11 Year 12 47 56 101 128 4,286 6,292 Asia-Pacific $ 471 594 4 $ 4660 $21 74 $ 4400 $ 5000 1 wk - 26% 180 days 174% $1.820 Year 11 Year 12 Actual Projected 188.9 209.3 8.6% 9.1% Yess 11 Year 12 45 66 97 124 3,055 5.022 $4150 $28.29 perut $ 3600 $ 4550 1 wk. 24% 180 days 17.4% 51.275 Year 11 Year 12 Actual Projected 133,5 146.7 8.4% 8.8% Year 11 Year 12 29 40 61 83 2.244 3,050 Market Segment Statistics AC Camera Demand and Market Share Unit Demand os Market Share IN Retail Outlets sumber wing to cary the Sauce Multi-Store Chains Online Retailers Local Retail Shops Price-Cost-Profit Breakdown (parunt sole Revenue Wholesale Price Projections - Promotional Discounts Exchange Rate Adjustment Net Revenues Operating Cost Cost of Units Assembled Projections Delivery Costud Marketing Costs Administrative Expenses Total Operating costs Operating Profit Operating Profit Margin operating promet revenues $ Per Unit 569.00 -29.77 -15.06 524 17 213.62 5.00 70.15 12.78 302 54 221 63 42.3% $ Per Unit 541.00 -2.39 -17.90 520.71 223.59 27 64 83.03 12.78 347 05 173.66 33.4% $ Per Unit 471.00 -2 38 -4.84 163.80 213.61 34 20 66 65 1278 S Per Unit 466.00 -2.15 -13.73 450 12 213.60 33.96 83.84 12.78 344 19 105.93 23.5% 327 31 136 50 29.4% Competitive Assumptions Anticipated industry Price to Retallers Average Marketing PIQ Rating Efforts in Year 12 Number of Models Retailer Support Advertising Budget Website Displays Sales Promotions Warranty Period North America $1470 punt 5.02 3.4. models $23.40 unit $ 4,144 (SDG) s 3.250.300) 11 wks 18.5% 225 days Europa-Africa $ 373 14.8 3.4. models $10.30 per $ 3.843 000) $ 3.179.000 10 wks 20.0% 250 days Asia-Pacific 31 348 4.8 3.4 - Models $10.50 per $3,050.000 $12,8140 10 wks 19.9% 2003 Latin America 3338. 4.8.2 3.4. models $12.70 per unit $12.075.000 $ 12,307 800 10 wks 18.9% 1200 days Latin America Asia-Pacific S 3100 9% 9% UAV DRONE MARKETING Average Retail Price Sant to directonine customers Discount Offered to 3rd-Party Online Retailers Buyer Appeal Variables Generated P/Q Rating from Product Design Decisions No. of Models Website Product Displays / Info 500 Search Engine Advertising soods Retailer Recruitment / Support Budget soos Retailer Recruitment/Support per party into Warranty period od 120 cm 180dw tym Expected Claim Rate Repair Cost 3000) North America Europe Africa $ 4950 $3200 6% 597 5.91 male 4 models $ 4800 $ 4100 $ 9000 $ 7200 $ 7800 $ 5500 $1,278 89 $83953 1 year 1 year 61.99 $3.840.0 41.996 SX400) Year 11 Year 12 Year 11 Year 12 Actual Projected Achal Projected 224 24.4 30.6 34.4 5.6 6.1 76 8.6 280 30.5 38.2 43.0 6.79 6.9% 10 298 10.8% Year 11 Year 12 Year 11 Year 12 44 34 33 34 5.972 odels $ 2800 $ 5200 $ 3100 $492 08 1 year 41.9%$3.950.0 Year 11 Year 12 Actual Projected 217 25.3 5.4 6.3 27.1 31.6 9.7% 10.4% Year 11 Year 12 29 27 $ 3300 10% 59 1 $ 2500 $ 4500 $ 500 $14708 1 1 year 41.9% 51 990.0 Year 11 Year 12 Achial Projected 9.9 11.6 2.8 3.5 12.5 15.0 7.8% Year 11 Year 12 20 17 Market Segment Statistics UAV Drone Demand - Directory and Market Share 3rd-Party thru einer Total Unit Demand Market Share 7.1% Online Retailers trip to carry the company which to Price-Cost-Profit Breakdown par un sold) -) Revenue Selling Price Projections + Exchange Rate Adjustment Net Revenues Operating Cost Cost of Units Assembled Projections Delivery Costcode Marketing Costs Administrative Expenses Total Operating Costs Operating Profit Operating Profit Margin operating pet-net severe Direct 3rd-Party Online Online Sales Retailers 4950 00 4 652 95 -138.28 -13000 4,811 72 4 529 95 1.494 39 1.494 59 62.50 12.16 565,67 1 278.69 18,69 1859 2,141.15 2 80443 2.670.57 1.718.52 56.5% 38.096 52.2% Direct 3rd-Party Direct3rd-Party Online Online Online Online Sales Retalers Sales Retailers 320000 2,911,90 3.10000 2.820 95 -106.31 -9674 -3202 -29.21 3093 69 2 615 23 306798 2 791 75 1.49401 149.419 1.493.44 1.495.40 190 49 129.02 248.50 181.75 328 49 539.53 316.21 492.06 18.59 18.72 18.56 18.73 2031.69 2 281.51 2076,802 187.94 1.062.01533.72 901.19 603.81 343% 19:05 32.3% 256% 31.5% 30.3% Direct 3rd-Party Online Online Sales Retailers 3.300.00 2.97000 -97.67 -87.94 3202 33 2842.06 1.492.41 1.501 10 260.52 190.88 503.45 147.06 18.52 18.82 2.375.00 1.857.94 827 33 1.024.12 25.8% 35.5% 27.9% Europe-Africa $ 2,369 per Asia-Pacific $ 2,331 punt | Competitive Assumptions Anticipated industry Average Retail Price Average Marketing Retailer Discount Efforts in Year 12 PIQ Rating Number of Models Website Displays Search Engine Advertising Retailer Recruitment Warranty Period North America $3,420 per 10.0 5.5 26. $13,375.00 35.844.00 51406.70 275 days 5.4. 2.7.me $ 3,121.00 $ 4,457 000 $ 352.80 GR 250 days 5.4 2.7.me $ 2,314-5000 $ 3,117 000 $326.20 henk 225. Jays Latin America $ 2,266 Juwont 9.0.1 5.4 2.7 ms $ 1,921 300 $2,507.00 274.20 W 200. Jos AC CAMERA WORKFORCE COMPENSATION UAV DRONE WORKFORCE COMPENSATION Compensation Decisions Companying Ava Year 121 Castean Compensation Decisions Company ind. Ava Year 12 lal yedi Base Wages PAT 10%- $22084 $21796 Base Wagen PAT 0% - $22,517 822 827 Assembly Quality Incentive $ 2.40 perunt 2.501 2.530 Assembly Quality Incentive $10.00 perut 5.917 3.921 Attendance Bonus $ 50 per worker 50 750 Attendance Bonus $ 1600 per 1,500 1050 Fringe Benefit Package $1 200 - pokus 200 1.850 Fringe Benefit Package $ 1800- 1 800 3.325 Total Compensation per works perem) S24.835 526 926 Total Compensation power year $31.734 $31 123 Best Practices / Productivity Improvement Training SPATI $7000 - Best Practices I Productivity Improvement Training Sest) $7000 - Projected PAT Productivity Ac. Camera units per put per year 3,489 Projected PAT Productivity in Deone units per PAT per year 1,801 AC CAMERA ASSEMBLY FACILITY UAV DRONE ASSEMBLY FACILITY Workstation Spaces Installed Workstations Workstation Spaces Installed Workstations At the End of Year 11 605 At the End of Year 11 582 wote At the End of Year 11 305 soates At the End of Year 11 277 Expansion now faces 0 R Installed for Y12 09 Expansion from 0 SM Installed for Y12 0 BOS Available for Year 12 005 Available for Year 12 582 Available for Year 12 305 Available for Year 12 277 km Additional Workstations Needed to Avoid Overtime Assembly 0 Additional Workstations Needed to Avoid Overtime Assembly 0 Assembly Capability of 2,031.0 OT 2,437.0 mm Assembly Capability of units 499.00 599.00 Projected Camera Demands of units 735.0 Projected Drone Demand 1000s of us 120.1 Expected ACC Unit Shortfall 0.00 Expected UAV Unit Shortfall 0.000 Labor Costs Units Unit Assembly and Labor Costs Labor Costs Units 10005 Unit Assembly and Labor Costs S000s S/unit DOOS S0005 Sunit ACC Assembly Regular-Time 7203 15,495 2151 UAV Assembly UAV Assembly Regular-Time 120.1 4.777 39 78 Overtime 00 0 0.00 Overtime 0.0 0 0.00 Training 1.439 2.00 Training 409 3.91 Total 7203 16 934 23 51 Total 1201 5225 43 68 Robotics Upgrade for All ACC Workstations Initiated in Y8 (reduce the number of persons per FAT from 4. J) $000 Cost Impact of Depreciation of a captal cost of upgrade) +4365 Upgrade -4209 500 Maintenance adidas Ok per wilt om +5 238 Interest financed with a stock issue 12252 Net Annual Cost impact of Robotics Upgrade 17566 Roboties Upgrade for All UAV Workstations Initiated in Ya to reduce the number of persons per PATHM to 5 Soos Cost Impact of Depreciation of 541 50k capital cost ograde Upgrade +2.078 Laborar -1729 Soo Maintenance ancora per restation +2493 Interest in financed was with a locale 1072 Net Annual Cost impact of Robotics Upgrade 3,514 Capital Expenditures workstns Expansion Upgrade New Facility Robotics Y12 Capital Outlays SO $0 SO Total Outlays Capital Expenditures worksns Expansion Upgrade Facility Robotics Y12 Capital Outlays 5800 $0 50 SO Total Outlays SO $0 Special Offers to Retailers of the Company's Brand of Cameras - Year 12 A few select large rctailors in each geographic region are accepting Special contract units are produced and assembled with the same offers from camera makers to supply Action Caplure Cameras at a specifications and P/Q rating as the company's regular AC Camera discount from regular wholesale prices. The two companies offering units first utilizing idle workstations if any are available) staffed the most attractive combinaton of pnce. Po rating and number of automaticaily with the required number of PATS, then overtimo models as measured by the Value Index shown below) are awarded assembly (if available and needed), and then outsourced assembly a contract to manufacture and deliver a volume of cameras equal to if needed) at a cost of $50 per unit assembled 10% of regular camera orders in Year 12 use the selections at the bottom to see the potential impact on All interested carriera manufacturers are invited to make a special overall company performance of winning one or more special wholesale discount offer. To make an offer enter whatever discount contracts Selecting "Yes in one or more regions has no impact on from regular wholesale price you are willing to bear. You may make whether or not a contract is awarded. This feature simply offers a offers in any or all regions or none at all. A discount offer of 0% means of anticipating the cash flow and profitability impact of winning indicates that you do not wish to compete for a special contract one or more special contracts SPECIAL OFFERS TO RETAILERS North America Europe Africa Asia-Pacific Latin America Wholesale Price to Retailers (as entered ca ACC MC De 5569 $541 $471 $466 Special Discount Offer gut we 10% 10% - 10% - 10%) Discount Price Offer to Large Retailers 5512 S487 $424 $439 Value Index of AC Camera Units Offered 32 34 39 39 Special Contract Units to be Assembled 1000) Projected Outcomes ople S0005 SHunit 5000s S Slunit $0005 Slunit 30005 Slunit Incremental Revenues will 7 218 497 79 7851 470 12 8768 419 52 5,983 407.01 Profitability - Variable Production Costs 2,030 140 00 2.504 149 94 2,926 140 00 2,082 140.27 Projections - Delivery Costs 87 6.00 425 25.45 857 31 44 458 3116 Contribution Margin 5 101 351.79 493279533 5.185 248.09 3,463 235.5a Potential Impact Earnings Per Share -0.5 +0.15 +0.16 +0.10 on Performance Return On Equity +0.396 +0.39 +0.3% -0.25 Measures Cash Flow 5000 +3,571 +3.452 -3.630 +2,424 14. ure 16.7 20.9 14.7 The projected outcome of winning a special contract may be Included in the overall Year 12 performance projections at the left. Select "Yes" for a region only if there is a reasonable probability of winning a special contract. incorporate the pro. Incorporate the pro Incorporate the pro. Incorporate the pro jected outcomes for jected outcomes for jected outcomes for jected outcomes for this region Inn Y12 this region Into Y12 this region into YIZ this region into Y12 projections? Yes projections? Yes projections? Yes projections? No Corporate Social Responsibility and Citizenship Below are sx CSRC Initiatives that can be used to develop a "social However which if any) of the six initiatives to pursue and how much responsibility strategy for your company. The drop-down selection to spend is entirely voluntary. There is no pressure to spend anything boxes below offer several optional actions on these initiatives the company can perform successfully without While practicing good corporate citizenship is often considered the undertaking any social responsibility initiatives. In Year 5. prior night thing to do one reason to operate in a socially responsible company management spent no money on any of the six optional manners to enhance the company's image Aggressive and astute Social responsibility initiatives pursuit of a social responsibility strategy over 5 years can increase The Help button at the top right offers further information and the company's Image Rating by 15 to 20 points guidance regarding the six CSRC Initiatives CSRC INITIATIVES Charitable Contributions $0 or 5.0% of operating profil of operating profit on the income Statements Other Expenses (reduces pretax income) Involves donations to registered charities and charitable causer Treated "Green" Initiatives to promote Involves use of onvironmentally friendly components, recycled materials and green shipping increases Environmental Sustainability Yes - production cost of AC Cameras by $2.00 and UAV Drones by 55.00 per unit shipping costs of AC Cameras by $1.00 and UAV Drones by 52 50 per unit and annual administrative costs by Sook Renewable Energy Program S 5000 involves ongoing expenditures to incorporate renewable energy resources at the Taiwan assembly facilities. These expenditures are treated as capital investment and deprecated a 5% per year. Cafeteria and On-Site Child Care Involves one-line capital investment of 525 million and increasco administrat Improved Facilities for Plant Employees Continue costs of $600k annually. Results in one-time productivity increases of 100 Working - units year for camera PATs and 50 unitsiyear for dine PATS Conditions Additional Safety Equipment and Involves one time capital investment of $3.0 million and increased administratie Improved Lighting/Ventilation Continue Co of $ok antically Results in one time productivity increases of 100 unistyear for camera Pasand 50 unitsyear for drone PATS Institution of a Supplier Code involves a dedicated effort to promote fair employment practices and safe working conditions at supplier of Conduct and Compliance Yes factories (tegarding excessive work hours, substandard wages, underage labor exposure to foxic Monitoring of Suppliers materials, and use work practices. Entails added annual adminative costs of $500K Y8 Y TO Yes Cash Outlays for Corporate Social Responsibility and Citizenship In Year 12 Total Cash Outiays $23,767 $ Perunt Sold $30.15 50009 Company CSRC Efforts Y7 Y9 Y11 Corporate Social Responsibility Award for Year 11 Charitable Contributions ) 0 12 784 25019 26 452 2.764 Best Practices "Green" Initiatives No Yes Yes Yes Runner-Up = Avengers Renewable Energy Program (1000) 05.000 5.000 3.000 2000 1,000 Industry 2 CSRC Cash Outlays Year 10 Year 11 Improved Working Facilities No Yes Yes Yes Conditions Safety/Lighting No Yes Yes Yos Yes Thousands of $ High 33 529 3, 441 Average 7.731 2,993 Supplier Code of Conduct NO NO Yes Yes Low 0 0 Total Cash - Thousands of 0 20 186 33.400 33.529 8,441 $ Per Unit Sold High 39.84 11.01 758 Outlays 0.00 2507 35.37 38.84 291 Average $ Per Unit Sold 11.01 Low 0.00 0 Yes Yes FINANCE AND CASH FLOW Sources of Additional Cash 500 1-Year Bank Loan 5-Year Bank Loan interest 10-Year Bank Loan (600 rest Stock Issue (251) Maximum share issue Y12 = 5000 0 0 0 5000 Uses for Excess Cash S600 Early Repayment of L-T None Loans NIA Dividende o 11 dividend w $9.54 Stock Repurchase 1000 of shares 5242 51) Memum har redan Y12 = 0 9.56 0 23 290 Shares of slock outstanding at the beginning of Year 2 18,290 Projected Cash Available in Year 12 Begiting Cash Balance cover von Wat $207,227 Cash Inflows Receipts from Sales 765 386 Bank Loans 1 Year 0 5 Year 0 10 Year 0 Stock Issue 5.000 a 5942511 1.212.550 Loan to Cover Overdraft cty Interest on Year 11 Cash Balance 2072 Cash Refund made by instructor 0 Cash Available from All Sources $2187 235 Shares of stock outstanding at the end of Year 12 Projected Cash Outlays in Year 12 Cash Outlays Payments to Component Suppliers Production and Assembly Expenses Delivery Marketing Admin Expenses Capital New Workstations Dulbays Robotics Upgrade Facilities Expansion Facilities Improvement Loan Principal1-Year Loans Repayment 6 Yea: Luis 10 Year Loans Interest Payments -Bank Loans Y11 Overdraft Stock Repurchases wham $142515 Income Tax Payments Dividend Payments Charitable Contributions Cash Fine Total Cash Outlays $ 194 910 97.363 157 256 0 0 0 5.000 0 0 97000 47310 0 0 66 014 222 420 13 962 0 $ 901.236 $ +1.286.000 Could generate interest income of $12.860k in Year 13. Projected Cash Balance at the End of Year 12 5000) Other Important Financial Statistics Last Year Interest Rate Paid on Overdraft Loans 6.7% Interest Rate Received on Cash Balances 1.7% Shareholder Equity and minimum - St. -89.0 ml Year 12 7.0% 1.0% 1.065.2 Performance on Credit Rating Measures Debt/Equity Percentage DE Interest Coverage Ratio ispering protest Current Ratio was create Last Year num 1188 2.29 Year 12 coded 43:57 6.17 9.33
Step by Step Solution
There are 3 Steps involved in it

Get step-by-step solutions from verified subject matter experts