

Answered step by step
Verified Expert Solution
Question
1 Approved Answer
How can we calculate Depreciation, Short Term Liability, Long Term Liability, and Solvency Ratio (Net profit is 1,950,985) Balance Sheet for Dec Y1 This Month
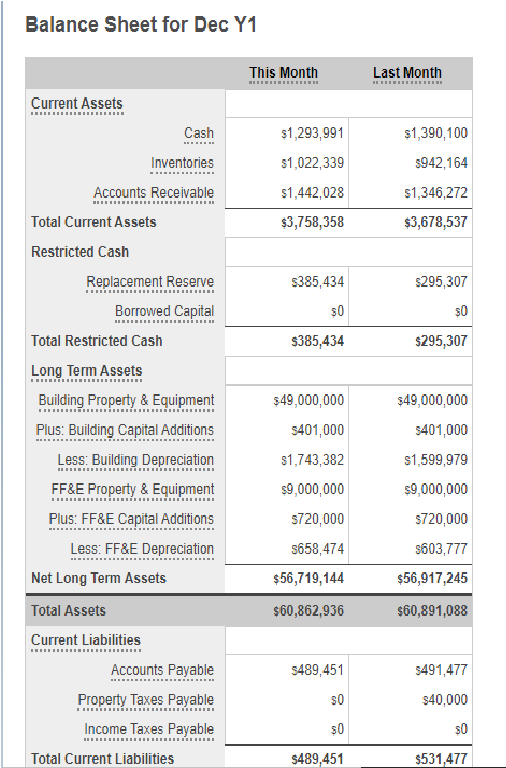
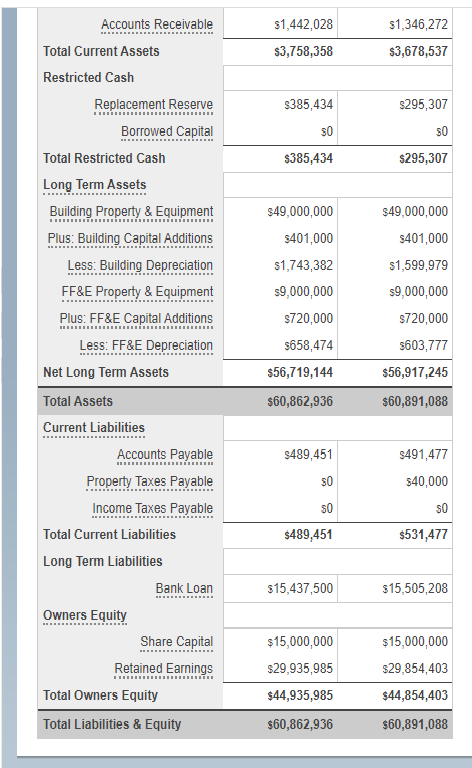
How can we calculate Depreciation, Short Term Liability, Long Term Liability, and Solvency Ratio (Net profit is 1,950,985)
Balance Sheet for Dec Y1 This Month Last Month Current Assets Cash $1,390,100 $942,164 Inventories $1,293,991 $1,022,339 $1,442,028 $3,758,358 $1,346,272 $3,678,537 $385,434 $0 $295,307 $0 $385,434 $295,307 Accounts Receivable Total Current Assets Restricted Cash Replacement Reserve Borrowed Capital Total Restricted Cash Long Term Assets Building Property & Equipment Plus: Building Capital Additions Less: Building Depreciation FF&E Property & Equipment Plus: FF&E Capital Additions Less: FF&E Depreciation Net Long Term Assets Total Assets Current Liabilities Accounts Payable Property Taxes Payable Income Taxes Payable Total Current Liabilities $49,000,000 5401,000 $1,743,382 $9,000,000 $720,000 5658,474 $56,719,144 $60,862,936 $49,000,000 5401,000 $1,599,979 $9,000,000 $720,000 5603,777 $56,917,245 $60,891,088 5489,451 5491,477 340,000 SO $0 $0 $489,451 $531,477 $1,346,272 $1,442,028 $3,758,358 $3,678,537 $295,307 $385,434 $0 $385,434 SO $295,307 Accounts Receivable Total Current Assets Restricted Cash Replacement Reserve Borrowed Capital Total Restricted Cash Long Term Assets Building Property & Equipment Plus: Building Capital Additions Less: Building Depreciation FF&E Property & Equipment Plus: FF&E Capital Additions Less: FF&E Depreciation Net Long Term Assets $49,000,000 5401,000 51,743,382 $9,000,000 $720,000 5658,474 $56,719,144 $49,000,000 5401,000 $1,599,979 $9,000,000 $720,000 $603,777 $56,917,245 $60,862,936 $60,891,088 Total Assets Current Liabilities $489,451 $491,477 540,000 50 $0 50 $489,451 $531,477 Accounts Payable Property Taxes Payable Income Taxes Payable Total Current Liabilities Long Term Liabilities Bank Loan Owners Equity Share Capital Retained Earnings Total Owners Equity Total Liabilities & Equity $15,437,500 $15,505,208 $15,000,000 $29,935,985 $44,935,985 $15,000,000 $29,854,403 $44,854,403 $60,862,936 $60,891,088Step by Step Solution
There are 3 Steps involved in it
Step: 1

Get Instant Access to Expert-Tailored Solutions
See step-by-step solutions with expert insights and AI powered tools for academic success
Step: 2

Step: 3
Ace Your Homework with AI
Get the answers you need in no time with our AI-driven, step-by-step assistance
Get Started
The Insiders Guide To Dol Plan Audits How To Survive An Employee Benefit Plan Audit
Authors: Frank J. Bitzer, Jr. Ferrigno, Nicholas W.
1st Edition
0872182711, 978-0872182714