

Question
HOW DID THEY GET THEIR ANSWERS? SHOW WORK. The ages (in years) of 10 men and their systolic blood pressures (in millimeters of mercury) are
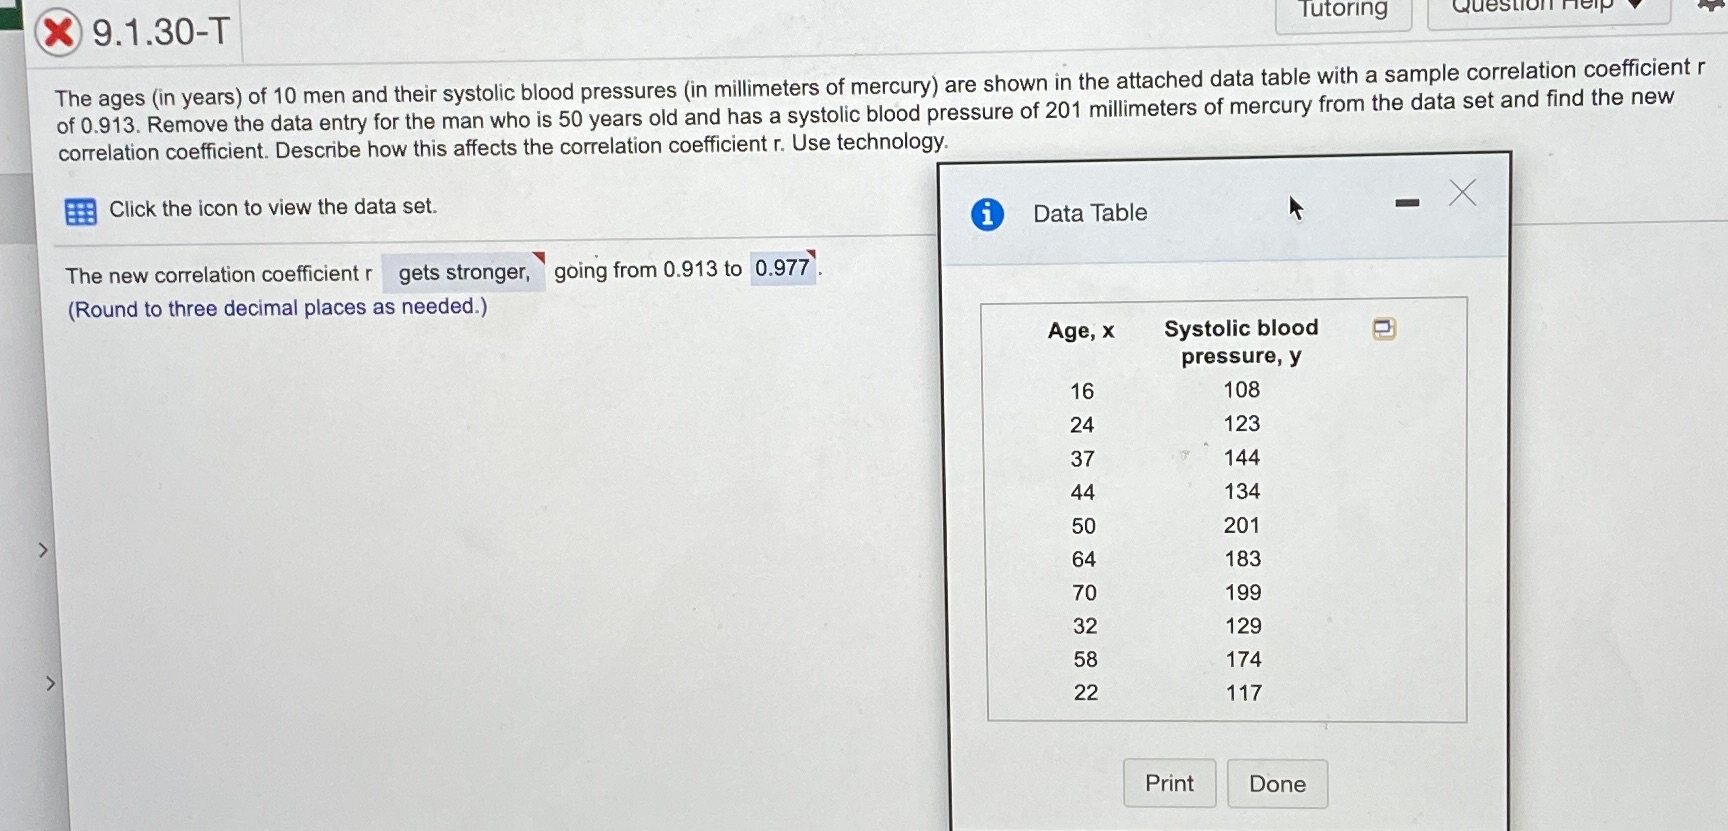
HOW DID THEY GET THEIR ANSWERS? SHOW WORK. The ages (in years) of 10 men and their systolic blood pressures (in millimeters of mercury) are shown in the attached (see photos) data table with a sample correlation r of 0.913. Remove the data entry for the man who is 50 years old and has a systolic blood pressure of 201 millimeters of mercury from the data set and find the new correlation coefficient. Describe how this affects the correlation coefficient r. Use Technology. ANSWER-------> Thew new correlation coefficient r gets stronger, going from 0.913 to 0.977. NEATLY show the work that got you to the answer above. Include the formula you used & what numbers were put into the formula
Step by Step Solution
There are 3 Steps involved in it
Step: 1

Get Instant Access to Expert-Tailored Solutions
See step-by-step solutions with expert insights and AI powered tools for academic success
Step: 2

Step: 3
Ace Your Homework with AI
Get the answers you need in no time with our AI-driven, step-by-step assistance
Get Started
Algebra And Trigonometry
Authors: Cynthia Y Young
3rd Edition
1118475755, 9781118475751