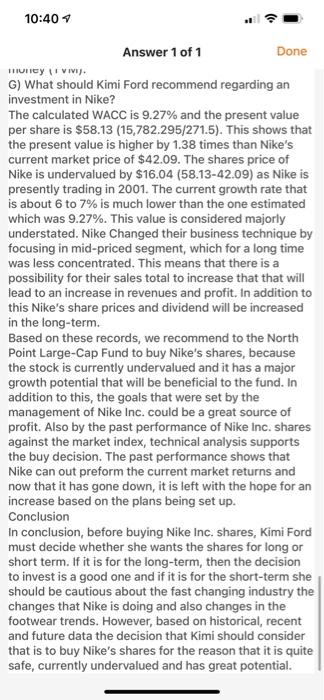
how did you find the question G? what should kim ford recommend regarding and investment in Nike? where did you find the number 15,782.295? how did you find it? where ? show all the steps please
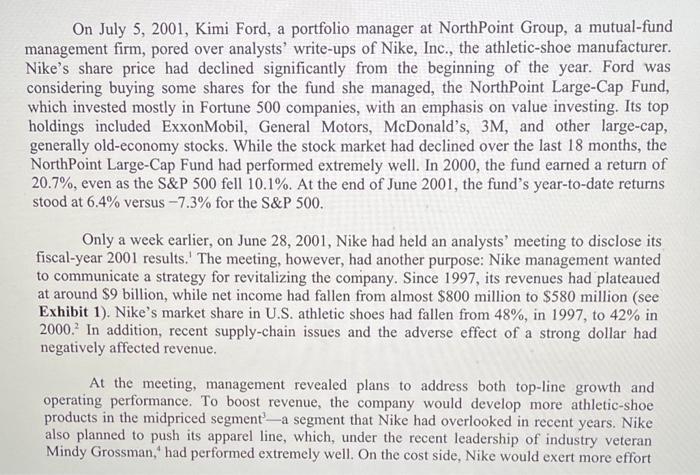
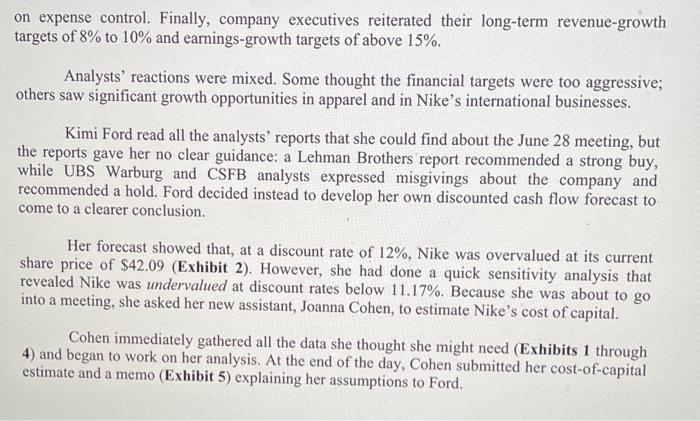
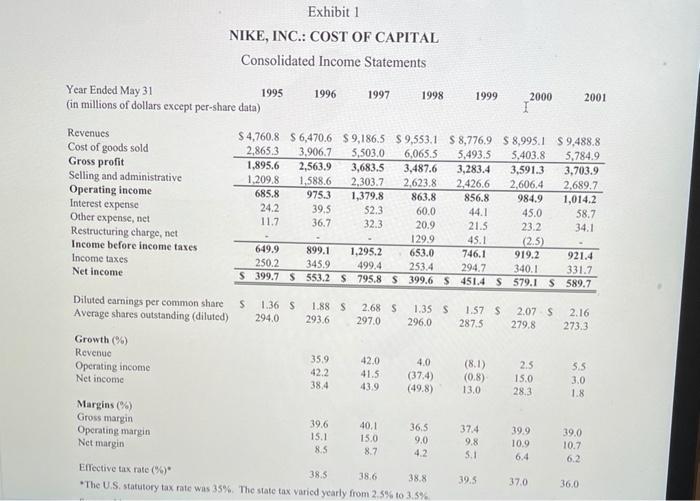
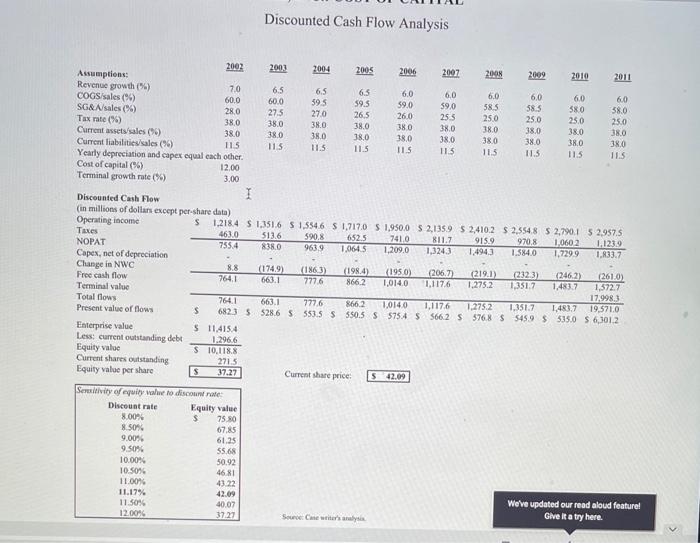
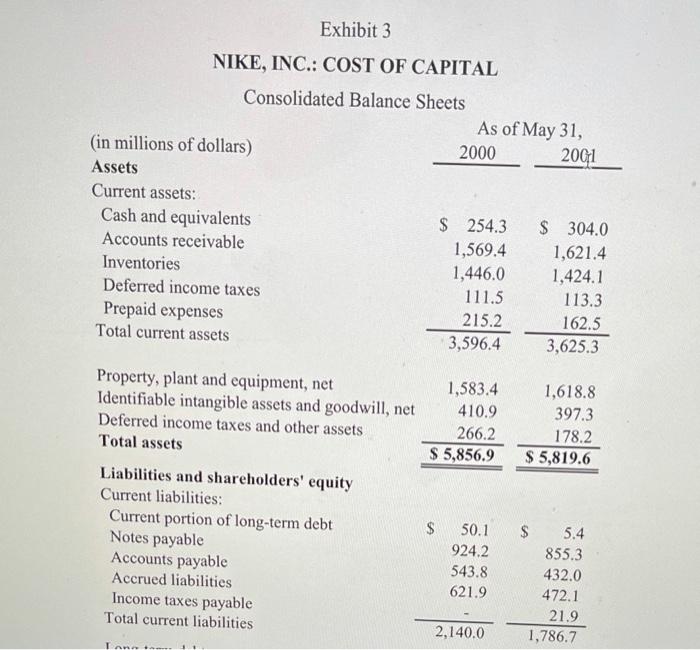
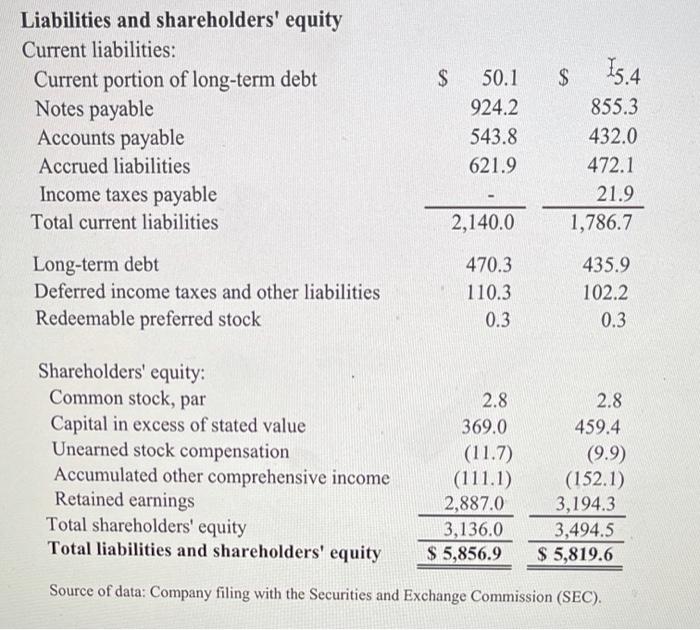
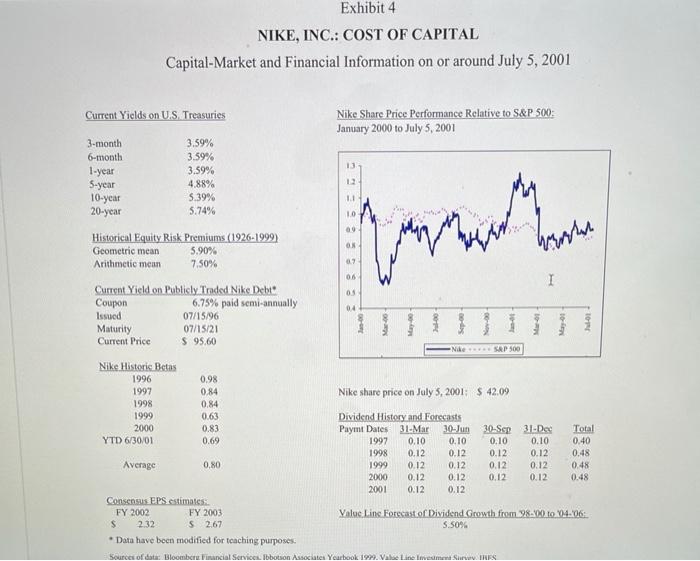
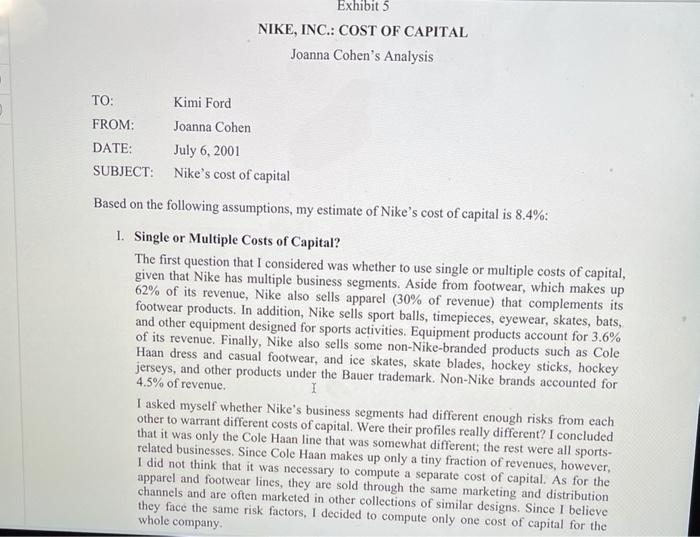
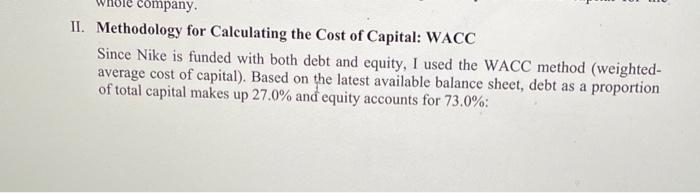
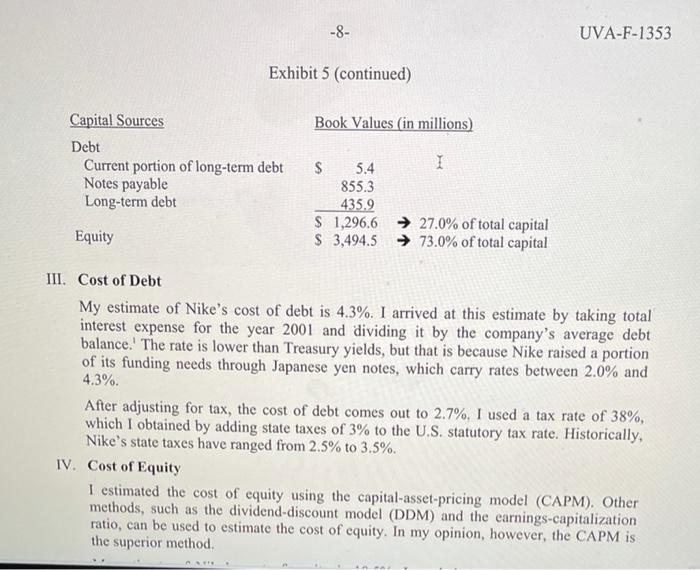
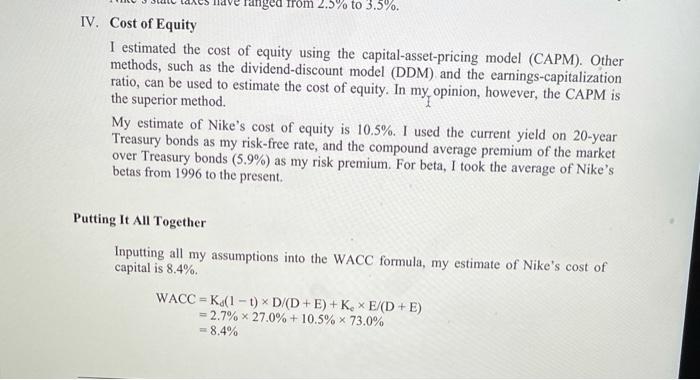
On July 5, 2001, Kimi Ford, a portfolio manager at NorthPoint Group, a mutual-fund management firm, pored over analysts' write-ups of Nike, Inc., the athletic-shoe manufacturer. Nike's share price had declined significantly from the beginning of the year. Ford was considering buying some shares for the fund she managed, the NorthPoint Large-Cap Fund, which invested mostly in Fortune 500 companies, with an emphasis on value investing. Its top holdings included ExxonMobil, General Motors, McDonald's, 3M, and other large-cap, generally old-economy stocks. While the stock market had declined over the last 18 months, the NorthPoint Large-Cap Fund had performed extremely well. In 2000, the fund earned a return of 20.7%, even as the S&P 500 fell 10.1%. At the end of June 2001, the fund's year-to-date returns stood at 6.4% versus -7.3% for the S&P 500. Only a week earlier, on June 28, 2001, Nike had held an analysts' meeting to disclose its fiscal-year 2001 results. The meeting, however, had another purpose: Nike management wanted to communicate a strategy for revitalizing the company. Since 1997, its revenues had plateaued at around $9 billion, while net income had fallen from almost $800 million to $580 million (see Exhibit 1). Nike's market share in U.S. athletic shoes had fallen from 48%, in 1997, to 42% in 2000. In addition, recent supply-chain issues and the adverse effect of a strong dollar had negatively affected revenue. At the meeting, management revealed plans to address both top-line growth and operating performance. To boost revenue, the company would develop more athletic-shoe products in the midpriced segment--a segment that Nike had overlooked in recent years. Nike also planned to push its apparel line, which, under the recent leadership of industry veteran Mindy Grossman,' had performed extremely well. On the cost side, Nike would exert more effort on expense control. Finally, company executives reiterated their long-term revenue-growth targets of 8% to 10% and earnings-growth targets of above 15%. Analysts' reactions were mixed. Some thought the financial targets were too aggressive; others saw significant growth opportunities in apparel and in Nike's international businesses. Kimi Ford read all the analysts' reports that she could find about the June 28 meeting, but the reports gave her no clear guidance: a Lehman Brothers report recommended a strong buy, while UBS Warburg and CSFB analysts expressed misgivings about the company and recommended a hold. Ford decided instead to develop her own discounted cash flow forecast to come to a clearer conclusion. Her forecast showed that, at a discount rate of 12%, Nike was overvalued at its current share price of $42.09 (Exhibit 2). However, she had done a quick sensitivity analysis that revealed Nike was undervalued at discount rates below 11.17%. Because she was about to go into a meeting, she asked her new assistant, Joanna Cohen, to estimate Nike's cost of capital. Cohen immediately gathered all the data she thought she might need (Exhibits 1 through 4) and began to work on her analysis. At the end of the day, Cohen submitted her cost-of-capital estimate and a memo (Exhibit 5) explaining her assumptions to Ford. Exhibit 1 NIKE, INC.: COST OF CAPITAL Consolidated Income Statements Year Ended May 31 1995 (in millions of dollars except per-share data) 1996 1997 1998 1999 2000 2001 Revenues Cost of goods sold Gross profit Selling and administrative Operating income Interest expense Other expense, net Restructuring charge, net Income before income taxes Income taxes Net Income $ 4,760.8 S 6,470.6 S 9,186,5 $ 9,553.1 $ 8,776.9 $ 8,995.1 S 9.488.8 2,865.3 3,906.7 5,503.0 6,065.5 5,493.5 5.403.8 5,784.9 1,895,6 2,563.9 3,683.5 3,487.6 3,283.4 3,591.3 3,703.9 1,209.8 1,588.6 2,303.7 2.623.8 2,426.6 2,606.4 2,689.7 685.8 975.3 1,379.8 863.8 856,8 984.9 1,014.2 24.2 39.5 52.3 60.0 44.1 45.0 58,7 11.7 36.7 32.3 20.9 21.5 23.2 34.1 129.9 45.1 (2.5) 649.9 899.1 1,295.2 653.0 746.1 919.2 921.4 250.2 345.9 499.4 253.4 294,7 340.1 331.7 S 399.7 $ 553.2 S 795.8 $399.6 $451.4 S 579.1 S 589.7 Diluted earnings per common share Average shares outstanding (diluted) S 1.36 S 294.0 1.88 $ 293.6 2.68 $ 2970 1.35s 296.0 1.57 $ 287.5 2.07 $ 279.8 2.16 273.3 Growth () Revenue Operating income Net income 35.9 42.2 38,4 42.0 41.5 4.0 (37.4) (49.8) (8.1) (0.8) 2.5 15.0 28.3 5.5 3.0 1.8 43.9 13.0 Margins (%) Gross margin Operating margin Net margin 39.6 39.9 15.1 40.1 15.0 8.7 36,5 9.0 4.2 374 9.8 5.1 39.0 10.7 10.9 8.5 6.4 6.2 Effective tax rate (%)" 38.5 38.6 38.8 "The U.S. statutory tax rate was 35%. The state tax varied yearly from 2.5% to 3.5% 39,5 37.0 36,0 Discounted Cash Flow Analysis 65 38.0 380 115 2002 2003 2004 2005 Assumptions: 2006 2007 2008 2009 2010 2011 Revenue growth (" 7.0 6.5 6.5 6.0 COGS sales (%) 6,0 6.0 6,0 60 60.0 60.0 595 59.5 59.0 SG&A/sales (%) 59.0 585 38.5 580 380 280 27.5 27.0 26,5 26.0 255 Tax rate(%) 250 250 25.0 25.0 38,0 38.0 38.0 380 38.0 Current assets/sales (9) 380 38,0 38.0 38.0 38.0 38,0 38.0 38.0 38,0 38.0 Current liabilities sales (96) 38.0 38,0 38,0 115 115 11.5 11.5 115 115 Yearly depreciation and capex equal each other. 11.5 11.5 11.5 Cost of capital (%) 12.00 Terminal growth rate(%) 3.00 Discounted Cash Flow I (in millions of dollars except per share data) Operating income S 1.218.4 S 1.351.6 5 1,554,6 S 1.717,0 $1,950,05 2,1359 52.410.2 $ 2.554.8 2,790.1 5 2957.5 Taxes 463.0 513.6 590.8 652.5 741,0 811.7 915.9 NOPAT 970,8 10602 1.123.9 7554 8380 9639 1,0645 1,209,0 1,3243 1.494) 1.584.0 Capex, net of depreciation 1.7299 1.833.7 Change in NWC 8,8 (1749) (1863) Free cash flow (1984) (1950) (206.7 219.1) 7641 (2323) (2462) (261.0) 663.1 7776 866.2 1.014.0 1.1176 Terminal value 1.275.2 1,3517 1,483.7 1,372.7 Total flows 17,998.3 7641 7776 866.2 1,0140 1,117,6 1.275.2 Present value of flows 1.351.7 1.483.7 19.571.0 $ 6823 5 5286 S553.5 S 550.5 5 575.4 $ 566 2 5 5768 S 545.9 $55.0 S 6,3012 Enterprise value $11.415.4 Les current outstanding debt 1.2966 Equity value $ 10.118.8 Current shares outstanding 271.5 Equity value per share s 37.27 Current share price 542.09 Sensitivity of equity value to discourwrote Discount rate Equity value 8.00 $ 75.80 8504 67,85 9.00% 61.25 9.50% 55.68 10.00% 50.92 10.50% 46.81 11.00% 43.22 11.17% 42.09 11.50 40.07 We've updated our read aloud feature! 12.0096 37.27 Source: Che writer's Give it a try here Exhibit 3 NIKE, INC.: COST OF CAPITAL Consolidated Balance Sheets As of May 31, (in millions of dollars) 2000 2061 Assets Current assets: Cash and equivalents Accounts receivable Inventories Deferred income taxes Prepaid expenses Total current assets $ 254.3 1,569.4 1,446.0 111.5 215.2 3,596.4 $ 304.0 1,621.4 1,424.1 113.3 162.5 3,625.3 Property, plant and equipment, net Identifiable intangible assets and goodwill, net Deferred income taxes and other assets Total assets 1,583.4 410.9 266.2 $ 5,856.9 1,618.8 397.3 178.2 $ 5,819.6 $ 5.4 Liabilities and shareholders' equity Current liabilities: Current portion of long-term debt Notes payable Accounts payable Accrued liabilities Income taxes payable Total current liabilities 50.1 $ 924.2 543.8 621.9 855.3 432.0 472.1 2,140.0 21.9 1,786.7 TA. $ 50.1 $ 15.4 924.2 855.3 Liabilities and shareholders' equity Current liabilities: Current portion of long-term debt Notes payable Accounts payable Accrued liabilities Income taxes payable Total current liabilities 543.8 432.0 621.9 472.1 21.9 2,140.0 1,786.7 470.3 435.9 Long-term debt Deferred income taxes and other liabilities Redeemable preferred stock 102.2 110.3 0.3 0.3 2.8 459.4 Shareholders' equity: Common stock, par Capital in excess of stated value Unearned stock compensation Accumulated other comprehensive income Retained earnings Total shareholders' equity Total liabilities and shareholders' equity 2.8 369.0 (11.7) (111.1) 2,887.0 3,136.0 $ 5,856.9 (9.9) (152.1) 3,194.3 3,494.5 $ 5,819.6 Source of data: Company filing with the Securities and Exchange Commission (SEC). Exhibit 4 NIKE, INC.: COST OF CAPITAL Capital Market and Financial Information on or around July 5, 2001 Current Yields on US Treasures Nike Share Price Performance Relative to S&P 500 January 2000 to July 5, 2001 3-month 13 6-month 1-year 5-year 10-year 20-year 3.59% 3.59% 3.59% 4.88% 5.39% 5.74% 12 11 10 Historical Equity Risk Premiums (1926-1999) parower ON Wer hat Geometric mean Arithmetic mean 5,90% 7.50% 07 06 I 03 04 Current Yield on Publicly Traded Nike Debt Coupon 6.75% paid semi-annually Issued 07/15/96 Maturity 07/15/21 Current Price $ 95,60 Na SRP 500 Nike Historic Betas 0.98 0.84 0.84 Nike share price on July 3, 2001: $ 42.09 1996 1997 1998 1999 2000 YTD 6/30/01 0.63 0.83 0.69 Dividend History and Forecasts Paymt Dates 31. Mar 30.Jun 1997 0.10 0.10 1998 0.12 0.12 1999 0.12 0.12 2000 0.12 0.12 2001 0.12 0.12 30-Sep 31 Dec 0.10 0.10 0.12 0.12 0.12 0.12 0.12 0.12 Tota! 0.40 0.48 0.48 Average 0,80 0.48 Consensus EPS estimates. FY 2002 FY 2003 $ 2.32 $ 2.67 Value Line Forecast of Dividend Growth from 98-00 to 104.06 5.5094 Data have been modified for teaching purposes Sources of data: Bloomberiancial Services. Ibbotson Associates Yearbook 1929. Vale Line Investment Sur IRS Exhibit 5 NIKE, INC.: COST OF CAPITAL Joanna Cohen's Analysis TO: Kimi Ford FROM: Joanna Cohen DATE: July 6, 2001 SUBJECT: Nike's cost of capital Based on the following assumptions, my estimate of Nike's cost of capital is 8.4%: 1. Single or Multiple Costs of Capital? The first question that I considered was whether to use single or multiple costs of capital, given that Nike has multiple business segments. Aside from footwear, which makes up 62% of its revenue, Nike also sells apparel (30% of revenue) that complements its footwear products. In addition, Nike sells sport balls, timepieces, eyewear, skates, bats, and other equipment designed for sports activities. Equipment products account for 3.6% of its revenue. Finally, Nike also sells some non-Nike-branded products such as Cole Haan dress and casual footwear, and ice skates, skate blades, hockey sticks, hockey jerseys, and other products under the Bauer trademark. Non-Nike brands accounted for 4.5% of revenue. I I asked myself whether Nike's business segments had different enough risks from each other to warrant different costs of capital. Were their profiles really different? I concluded that it was only the Cole Haan line that was somewhat different, the rest were all sports- related businesses. Since Cole Haan makes up only a tiny fraction of revenues, however, I did not think that it was necessary to compute a separate cost of capital. As for the apparel and footwear lines, they are sold through the same marketing and distribution channels and are often marketed in other collections of similar designs. Since I believe they face the same risk factors, I decided to compute only one cost of capital for the whole company Exhibit 5 NIKE, INC.: COST OF CAPITAL Joanna Cohen's Analysis TO: Kimi Ford FROM: Joanna Cohen DATE: July 6, 2001 SUBJECT: Nike's cost of capital Based on the following assumptions, my estimate of Nike's cost of capital is 8.4%: 1. Single or Multiple Costs of Capital? The first question that I considered was whether to use single or multiple costs of capital, given that Nike has multiple business segments. Aside from footwear, which makes up 62% of its revenue, Nike also sells apparel (30% of revenue) that complements its footwear products. In addition, Nike sells sport balls, timepieces, eyewear, skates, bats, and other equipment designed for sports activities. Equipment products account for 3.6% of its revenue. Finally, Nike also sells some non-Nike-branded products such as Cole Haan dress and casual footwear, and ice skates, skate blades, hockey sticks, hockey jerseys, and other products under the Bauer trademark. Non-Nike brands accounted for 4.5% of revenue. I I asked myself whether Nike's business segments had different enough risks from each other to warrant different costs of capital. Were their profiles really different? I concluded that it was only the Cole Haan line that was somewhat different, the rest were all sports- related businesses. Since Cole Haan makes up only a tiny fraction of revenues, however, I did not think that it was necessary to compute a separate cost of capital. As for the apparel and footwear lines, they are sold through the same marketing and distribution channels and are often marketed in other collections of similar designs. Since I believe they face the same risk factors, I decided to compute only one cost of capital for the whole company company. II. Methodology for Calculating the Cost of Capital: WACC Since Nike is funded with both debt and equity, I used the WACC method (weighted- average cost of capital). Based on the latest available balance sheet, debt as a proportion of total capital makes up 27.0% and equity accounts for 73.0%: -8- UVA-F-1353 Exhibit 5 (continued) Capital Sources Book Values (in millions) Debt Current portion of long-term debt Notes payable Long-term debt $ 5.4 1 855.3 435.2 $ 1,296.6 27.0% of total capital $ 3,494.5 73.0% of total capital Equity III. Cost of Debt My estimate of Nike's cost of debt is 4.3%. I arrived at this estimate by taking total interest expense for the year 2001 and dividing it by the company's average debt balance.' The rate is lower than Treasury yields, but that is because Nike raised a portion of its funding needs through Japanese yen notes, which carry rates between 2.0% and 4.3%. After adjusting for tax, the cost of debt comes out to 2.7%. I used a tax rate of 38%, which I obtained by adding state taxes of 3% to the U.S. statutory tax rate. Historically, Nike's state taxes have ranged from 2.5% to 3.5%. IV. Cost of Equity I estimated the cost of equity using the capital-asset-pricing model (CAPM). Other methods, such as the dividend-discount model (DDM) and the earnings-capitalization ratio, can be used to estimate the cost of cquity. In my opinion, however, the CAPM is the superior method. nged from 2.5% to 3.5%. IV. Cost of Equity I estimated the cost of equity using the capital-asset-pricing model (CAPM). Other methods, such as the dividend-discount model (DDM) and the earnings-capitalization ratio, can be used to estimate the cost of equity. In my opinion, however, the CAPM is the superior method. My estimate of Nike's cost of equity is 10.5%. I used the current yield on 20-year Treasury bonds as my risk-free rate, and the compound average premium of the market over Treasury bonds (5.9%) as my risk premium. For beta, I took the average of Nike's betas from 1996 to the present. Putting It All Together Inputting all my assumptions into the WACC formula, my estimate of Nike's cost of capital is 8.4%. WACC = (1 - t) D/(D+E) + Ke E/(D+E) = 2.7% x 27.0% +10.5% x 73.0% = 8.4% 10:40 Answer 1 of 1 Done TRUIEN VIV. G) What should Kimi Ford recommend regarding an investment in Nike? The calculated WACC is 9.27% and the present value per share is $58.13 (15,782.295/271.5). This shows that the present value is higher by 1.38 times than Nike's current market price of $42.09. The shares price of Nike is undervalued by $16.04 (58.13-42.09) as Nike is presently trading in 2001. The current growth rate that is about 6 to 7% is much lower than the one estimated which was 9.27%. This value is considered majorly understated. Nike Changed their business technique by focusing in mid-priced segment, which for a long time was less concentrated. This means that there is a possibility for their sales total to increase that that will lead to an increase in revenues and profit. In addition to this Nike's share prices and dividend will be increased in the long-term. Based on these records, we recommend to the North Point Large-Cap Fund to buy Nike's shares, because the stock is currently undervalued and it has a major growth potential that will be beneficial to the fund. In addition to this, the goals that were set by the management of Nike Inc. could be a great source of profit. Also by the past performance of Nike Inc. shares against the market index, technical analysis supports the buy decision. The past performance shows that Nike can out preform the current market returns and now that it has gone down, it is left with the hope for an increase based on the plans being set up. Conclusion In conclusion, before buying Nike Inc. shares, Kimi Ford must decide whether she wants the shares for long or short term. If it is for the long-term, then the decision to invest is a good one and if it is for the short-term she should be cautious about the fast changing industry the changes that Nike is doing and also changes in the footwear trends. However, based on historical , recent and future data the decision that kimi should consider that is to buy Nike's shares for the reason that it is quite safe, currently undervalued and has great potential. On July 5, 2001, Kimi Ford, a portfolio manager at NorthPoint Group, a mutual-fund management firm, pored over analysts' write-ups of Nike, Inc., the athletic-shoe manufacturer. Nike's share price had declined significantly from the beginning of the year. Ford was considering buying some shares for the fund she managed, the NorthPoint Large-Cap Fund, which invested mostly in Fortune 500 companies, with an emphasis on value investing. Its top holdings included ExxonMobil, General Motors, McDonald's, 3M, and other large-cap, generally old-economy stocks. While the stock market had declined over the last 18 months, the NorthPoint Large-Cap Fund had performed extremely well. In 2000, the fund earned a return of 20.7%, even as the S&P 500 fell 10.1%. At the end of June 2001, the fund's year-to-date returns stood at 6.4% versus -7.3% for the S&P 500. Only a week earlier, on June 28, 2001, Nike had held an analysts' meeting to disclose its fiscal-year 2001 results. The meeting, however, had another purpose: Nike management wanted to communicate a strategy for revitalizing the company. Since 1997, its revenues had plateaued at around $9 billion, while net income had fallen from almost $800 million to $580 million (see Exhibit 1). Nike's market share in U.S. athletic shoes had fallen from 48%, in 1997, to 42% in 2000. In addition, recent supply-chain issues and the adverse effect of a strong dollar had negatively affected revenue. At the meeting, management revealed plans to address both top-line growth and operating performance. To boost revenue, the company would develop more athletic-shoe products in the midpriced segment--a segment that Nike had overlooked in recent years. Nike also planned to push its apparel line, which, under the recent leadership of industry veteran Mindy Grossman,' had performed extremely well. On the cost side, Nike would exert more effort on expense control. Finally, company executives reiterated their long-term revenue-growth targets of 8% to 10% and earnings-growth targets of above 15%. Analysts' reactions were mixed. Some thought the financial targets were too aggressive; others saw significant growth opportunities in apparel and in Nike's international businesses. Kimi Ford read all the analysts' reports that she could find about the June 28 meeting, but the reports gave her no clear guidance: a Lehman Brothers report recommended a strong buy, while UBS Warburg and CSFB analysts expressed misgivings about the company and recommended a hold. Ford decided instead to develop her own discounted cash flow forecast to come to a clearer conclusion. Her forecast showed that, at a discount rate of 12%, Nike was overvalued at its current share price of $42.09 (Exhibit 2). However, she had done a quick sensitivity analysis that revealed Nike was undervalued at discount rates below 11.17%. Because she was about to go into a meeting, she asked her new assistant, Joanna Cohen, to estimate Nike's cost of capital. Cohen immediately gathered all the data she thought she might need (Exhibits 1 through 4) and began to work on her analysis. At the end of the day, Cohen submitted her cost-of-capital estimate and a memo (Exhibit 5) explaining her assumptions to Ford. Exhibit 1 NIKE, INC.: COST OF CAPITAL Consolidated Income Statements Year Ended May 31 1995 (in millions of dollars except per-share data) 1996 1997 1998 1999 2000 2001 Revenues Cost of goods sold Gross profit Selling and administrative Operating income Interest expense Other expense, net Restructuring charge, net Income before income taxes Income taxes Net Income $ 4,760.8 S 6,470.6 S 9,186,5 $ 9,553.1 $ 8,776.9 $ 8,995.1 S 9.488.8 2,865.3 3,906.7 5,503.0 6,065.5 5,493.5 5.403.8 5,784.9 1,895,6 2,563.9 3,683.5 3,487.6 3,283.4 3,591.3 3,703.9 1,209.8 1,588.6 2,303.7 2.623.8 2,426.6 2,606.4 2,689.7 685.8 975.3 1,379.8 863.8 856,8 984.9 1,014.2 24.2 39.5 52.3 60.0 44.1 45.0 58,7 11.7 36.7 32.3 20.9 21.5 23.2 34.1 129.9 45.1 (2.5) 649.9 899.1 1,295.2 653.0 746.1 919.2 921.4 250.2 345.9 499.4 253.4 294,7 340.1 331.7 S 399.7 $ 553.2 S 795.8 $399.6 $451.4 S 579.1 S 589.7 Diluted earnings per common share Average shares outstanding (diluted) S 1.36 S 294.0 1.88 $ 293.6 2.68 $ 2970 1.35s 296.0 1.57 $ 287.5 2.07 $ 279.8 2.16 273.3 Growth () Revenue Operating income Net income 35.9 42.2 38,4 42.0 41.5 4.0 (37.4) (49.8) (8.1) (0.8) 2.5 15.0 28.3 5.5 3.0 1.8 43.9 13.0 Margins (%) Gross margin Operating margin Net margin 39.6 39.9 15.1 40.1 15.0 8.7 36,5 9.0 4.2 374 9.8 5.1 39.0 10.7 10.9 8.5 6.4 6.2 Effective tax rate (%)" 38.5 38.6 38.8 "The U.S. statutory tax rate was 35%. The state tax varied yearly from 2.5% to 3.5% 39,5 37.0 36,0 Discounted Cash Flow Analysis 65 38.0 380 115 2002 2003 2004 2005 Assumptions: 2006 2007 2008 2009 2010 2011 Revenue growth (" 7.0 6.5 6.5 6.0 COGS sales (%) 6,0 6.0 6,0 60 60.0 60.0 595 59.5 59.0 SG&A/sales (%) 59.0 585 38.5 580 380 280 27.5 27.0 26,5 26.0 255 Tax rate(%) 250 250 25.0 25.0 38,0 38.0 38.0 380 38.0 Current assets/sales (9) 380 38,0 38.0 38.0 38.0 38,0 38.0 38.0 38,0 38.0 Current liabilities sales (96) 38.0 38,0 38,0 115 115 11.5 11.5 115 115 Yearly depreciation and capex equal each other. 11.5 11.5 11.5 Cost of capital (%) 12.00 Terminal growth rate(%) 3.00 Discounted Cash Flow I (in millions of dollars except per share data) Operating income S 1.218.4 S 1.351.6 5 1,554,6 S 1.717,0 $1,950,05 2,1359 52.410.2 $ 2.554.8 2,790.1 5 2957.5 Taxes 463.0 513.6 590.8 652.5 741,0 811.7 915.9 NOPAT 970,8 10602 1.123.9 7554 8380 9639 1,0645 1,209,0 1,3243 1.494) 1.584.0 Capex, net of depreciation 1.7299 1.833.7 Change in NWC 8,8 (1749) (1863) Free cash flow (1984) (1950) (206.7 219.1) 7641 (2323) (2462) (261.0) 663.1 7776 866.2 1.014.0 1.1176 Terminal value 1.275.2 1,3517 1,483.7 1,372.7 Total flows 17,998.3 7641 7776 866.2 1,0140 1,117,6 1.275.2 Present value of flows 1.351.7 1.483.7 19.571.0 $ 6823 5 5286 S553.5 S 550.5 5 575.4 $ 566 2 5 5768 S 545.9 $55.0 S 6,3012 Enterprise value $11.415.4 Les current outstanding debt 1.2966 Equity value $ 10.118.8 Current shares outstanding 271.5 Equity value per share s 37.27 Current share price 542.09 Sensitivity of equity value to discourwrote Discount rate Equity value 8.00 $ 75.80 8504 67,85 9.00% 61.25 9.50% 55.68 10.00% 50.92 10.50% 46.81 11.00% 43.22 11.17% 42.09 11.50 40.07 We've updated our read aloud feature! 12.0096 37.27 Source: Che writer's Give it a try here Exhibit 3 NIKE, INC.: COST OF CAPITAL Consolidated Balance Sheets As of May 31, (in millions of dollars) 2000 2061 Assets Current assets: Cash and equivalents Accounts receivable Inventories Deferred income taxes Prepaid expenses Total current assets $ 254.3 1,569.4 1,446.0 111.5 215.2 3,596.4 $ 304.0 1,621.4 1,424.1 113.3 162.5 3,625.3 Property, plant and equipment, net Identifiable intangible assets and goodwill, net Deferred income taxes and other assets Total assets 1,583.4 410.9 266.2 $ 5,856.9 1,618.8 397.3 178.2 $ 5,819.6 $ 5.4 Liabilities and shareholders' equity Current liabilities: Current portion of long-term debt Notes payable Accounts payable Accrued liabilities Income taxes payable Total current liabilities 50.1 $ 924.2 543.8 621.9 855.3 432.0 472.1 2,140.0 21.9 1,786.7 TA. $ 50.1 $ 15.4 924.2 855.3 Liabilities and shareholders' equity Current liabilities: Current portion of long-term debt Notes payable Accounts payable Accrued liabilities Income taxes payable Total current liabilities 543.8 432.0 621.9 472.1 21.9 2,140.0 1,786.7 470.3 435.9 Long-term debt Deferred income taxes and other liabilities Redeemable preferred stock 102.2 110.3 0.3 0.3 2.8 459.4 Shareholders' equity: Common stock, par Capital in excess of stated value Unearned stock compensation Accumulated other comprehensive income Retained earnings Total shareholders' equity Total liabilities and shareholders' equity 2.8 369.0 (11.7) (111.1) 2,887.0 3,136.0 $ 5,856.9 (9.9) (152.1) 3,194.3 3,494.5 $ 5,819.6 Source of data: Company filing with the Securities and Exchange Commission (SEC). Exhibit 4 NIKE, INC.: COST OF CAPITAL Capital Market and Financial Information on or around July 5, 2001 Current Yields on US Treasures Nike Share Price Performance Relative to S&P 500 January 2000 to July 5, 2001 3-month 13 6-month 1-year 5-year 10-year 20-year 3.59% 3.59% 3.59% 4.88% 5.39% 5.74% 12 11 10 Historical Equity Risk Premiums (1926-1999) parower ON Wer hat Geometric mean Arithmetic mean 5,90% 7.50% 07 06 I 03 04 Current Yield on Publicly Traded Nike Debt Coupon 6.75% paid semi-annually Issued 07/15/96 Maturity 07/15/21 Current Price $ 95,60 Na SRP 500 Nike Historic Betas 0.98 0.84 0.84 Nike share price on July 3, 2001: $ 42.09 1996 1997 1998 1999 2000 YTD 6/30/01 0.63 0.83 0.69 Dividend History and Forecasts Paymt Dates 31. Mar 30.Jun 1997 0.10 0.10 1998 0.12 0.12 1999 0.12 0.12 2000 0.12 0.12 2001 0.12 0.12 30-Sep 31 Dec 0.10 0.10 0.12 0.12 0.12 0.12 0.12 0.12 Tota! 0.40 0.48 0.48 Average 0,80 0.48 Consensus EPS estimates. FY 2002 FY 2003 $ 2.32 $ 2.67 Value Line Forecast of Dividend Growth from 98-00 to 104.06 5.5094 Data have been modified for teaching purposes Sources of data: Bloomberiancial Services. Ibbotson Associates Yearbook 1929. Vale Line Investment Sur IRS Exhibit 5 NIKE, INC.: COST OF CAPITAL Joanna Cohen's Analysis TO: Kimi Ford FROM: Joanna Cohen DATE: July 6, 2001 SUBJECT: Nike's cost of capital Based on the following assumptions, my estimate of Nike's cost of capital is 8.4%: 1. Single or Multiple Costs of Capital? The first question that I considered was whether to use single or multiple costs of capital, given that Nike has multiple business segments. Aside from footwear, which makes up 62% of its revenue, Nike also sells apparel (30% of revenue) that complements its footwear products. In addition, Nike sells sport balls, timepieces, eyewear, skates, bats, and other equipment designed for sports activities. Equipment products account for 3.6% of its revenue. Finally, Nike also sells some non-Nike-branded products such as Cole Haan dress and casual footwear, and ice skates, skate blades, hockey sticks, hockey jerseys, and other products under the Bauer trademark. Non-Nike brands accounted for 4.5% of revenue. I I asked myself whether Nike's business segments had different enough risks from each other to warrant different costs of capital. Were their profiles really different? I concluded that it was only the Cole Haan line that was somewhat different, the rest were all sports- related businesses. Since Cole Haan makes up only a tiny fraction of revenues, however, I did not think that it was necessary to compute a separate cost of capital. As for the apparel and footwear lines, they are sold through the same marketing and distribution channels and are often marketed in other collections of similar designs. Since I believe they face the same risk factors, I decided to compute only one cost of capital for the whole company Exhibit 5 NIKE, INC.: COST OF CAPITAL Joanna Cohen's Analysis TO: Kimi Ford FROM: Joanna Cohen DATE: July 6, 2001 SUBJECT: Nike's cost of capital Based on the following assumptions, my estimate of Nike's cost of capital is 8.4%: 1. Single or Multiple Costs of Capital? The first question that I considered was whether to use single or multiple costs of capital, given that Nike has multiple business segments. Aside from footwear, which makes up 62% of its revenue, Nike also sells apparel (30% of revenue) that complements its footwear products. In addition, Nike sells sport balls, timepieces, eyewear, skates, bats, and other equipment designed for sports activities. Equipment products account for 3.6% of its revenue. Finally, Nike also sells some non-Nike-branded products such as Cole Haan dress and casual footwear, and ice skates, skate blades, hockey sticks, hockey jerseys, and other products under the Bauer trademark. Non-Nike brands accounted for 4.5% of revenue. I I asked myself whether Nike's business segments had different enough risks from each other to warrant different costs of capital. Were their profiles really different? I concluded that it was only the Cole Haan line that was somewhat different, the rest were all sports- related businesses. Since Cole Haan makes up only a tiny fraction of revenues, however, I did not think that it was necessary to compute a separate cost of capital. As for the apparel and footwear lines, they are sold through the same marketing and distribution channels and are often marketed in other collections of similar designs. Since I believe they face the same risk factors, I decided to compute only one cost of capital for the whole company company. II. Methodology for Calculating the Cost of Capital: WACC Since Nike is funded with both debt and equity, I used the WACC method (weighted- average cost of capital). Based on the latest available balance sheet, debt as a proportion of total capital makes up 27.0% and equity accounts for 73.0%: -8- UVA-F-1353 Exhibit 5 (continued) Capital Sources Book Values (in millions) Debt Current portion of long-term debt Notes payable Long-term debt $ 5.4 1 855.3 435.2 $ 1,296.6 27.0% of total capital $ 3,494.5 73.0% of total capital Equity III. Cost of Debt My estimate of Nike's cost of debt is 4.3%. I arrived at this estimate by taking total interest expense for the year 2001 and dividing it by the company's average debt balance.' The rate is lower than Treasury yields, but that is because Nike raised a portion of its funding needs through Japanese yen notes, which carry rates between 2.0% and 4.3%. After adjusting for tax, the cost of debt comes out to 2.7%. I used a tax rate of 38%, which I obtained by adding state taxes of 3% to the U.S. statutory tax rate. Historically, Nike's state taxes have ranged from 2.5% to 3.5%. IV. Cost of Equity I estimated the cost of equity using the capital-asset-pricing model (CAPM). Other methods, such as the dividend-discount model (DDM) and the earnings-capitalization ratio, can be used to estimate the cost of cquity. In my opinion, however, the CAPM is the superior method. nged from 2.5% to 3.5%. IV. Cost of Equity I estimated the cost of equity using the capital-asset-pricing model (CAPM). Other methods, such as the dividend-discount model (DDM) and the earnings-capitalization ratio, can be used to estimate the cost of equity. In my opinion, however, the CAPM is the superior method. My estimate of Nike's cost of equity is 10.5%. I used the current yield on 20-year Treasury bonds as my risk-free rate, and the compound average premium of the market over Treasury bonds (5.9%) as my risk premium. For beta, I took the average of Nike's betas from 1996 to the present. Putting It All Together Inputting all my assumptions into the WACC formula, my estimate of Nike's cost of capital is 8.4%. WACC = (1 - t) D/(D+E) + Ke E/(D+E) = 2.7% x 27.0% +10.5% x 73.0% = 8.4% 10:40 Answer 1 of 1 Done TRUIEN VIV. G) What should Kimi Ford recommend regarding an investment in Nike? The calculated WACC is 9.27% and the present value per share is $58.13 (15,782.295/271.5). This shows that the present value is higher by 1.38 times than Nike's current market price of $42.09. The shares price of Nike is undervalued by $16.04 (58.13-42.09) as Nike is presently trading in 2001. The current growth rate that is about 6 to 7% is much lower than the one estimated which was 9.27%. This value is considered majorly understated. Nike Changed their business technique by focusing in mid-priced segment, which for a long time was less concentrated. This means that there is a possibility for their sales total to increase that that will lead to an increase in revenues and profit. In addition to this Nike's share prices and dividend will be increased in the long-term. Based on these records, we recommend to the North Point Large-Cap Fund to buy Nike's shares, because the stock is currently undervalued and it has a major growth potential that will be beneficial to the fund. In addition to this, the goals that were set by the management of Nike Inc. could be a great source of profit. Also by the past performance of Nike Inc. shares against the market index, technical analysis supports the buy decision. The past performance shows that Nike can out preform the current market returns and now that it has gone down, it is left with the hope for an increase based on the plans being set up. Conclusion In conclusion, before buying Nike Inc. shares, Kimi Ford must decide whether she wants the shares for long or short term. If it is for the long-term, then the decision to invest is a good one and if it is for the short-term she should be cautious about the fast changing industry the changes that Nike is doing and also changes in the footwear trends. However, based on historical , recent and future data the decision that kimi should consider that is to buy Nike's shares for the reason that it is quite safe, currently undervalued and has great potential