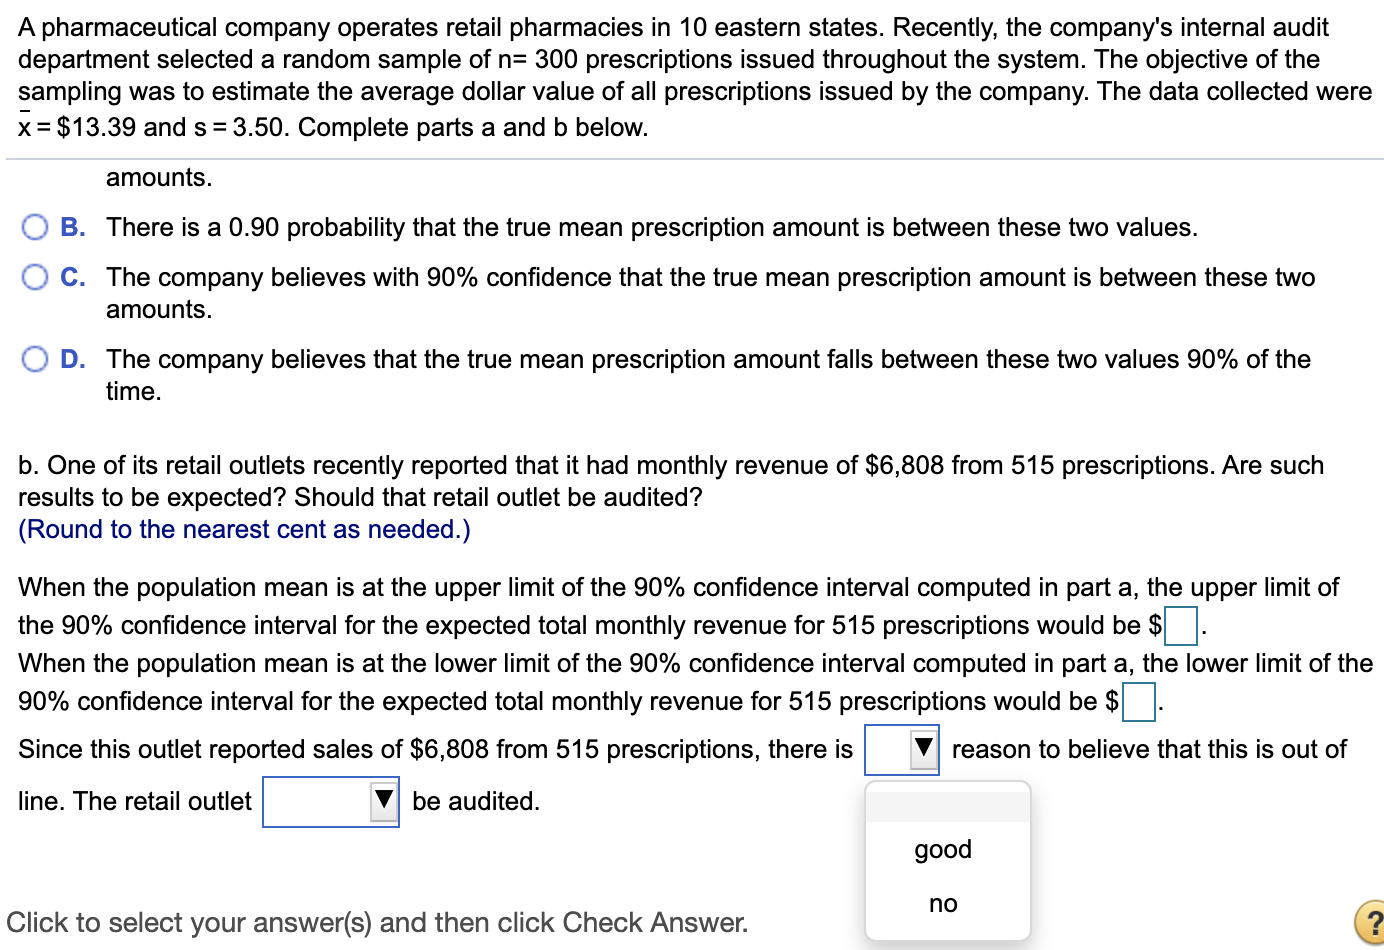
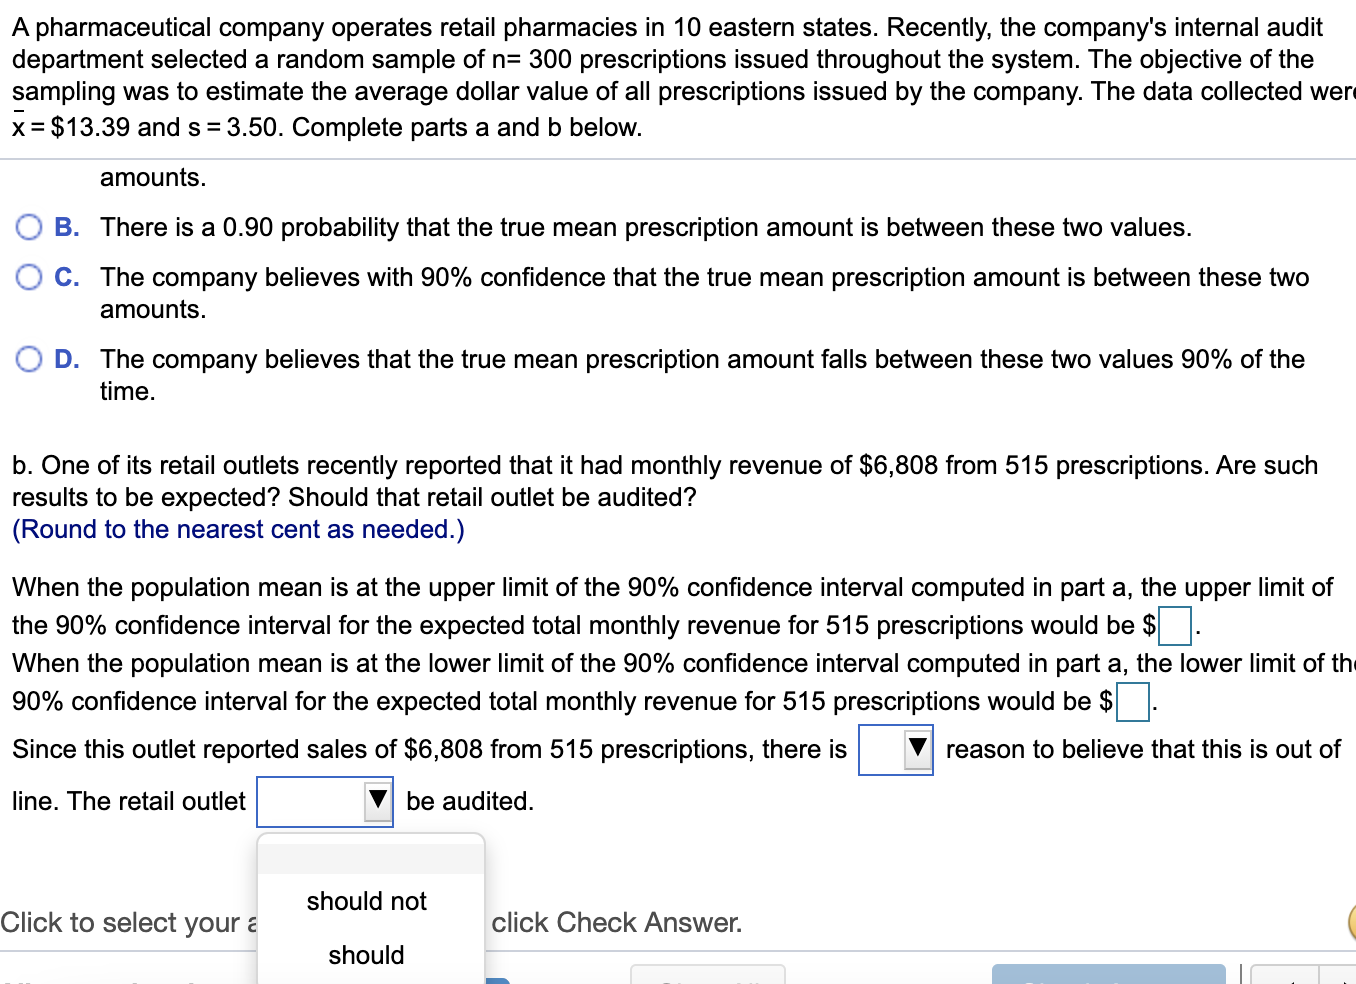
how do i answer
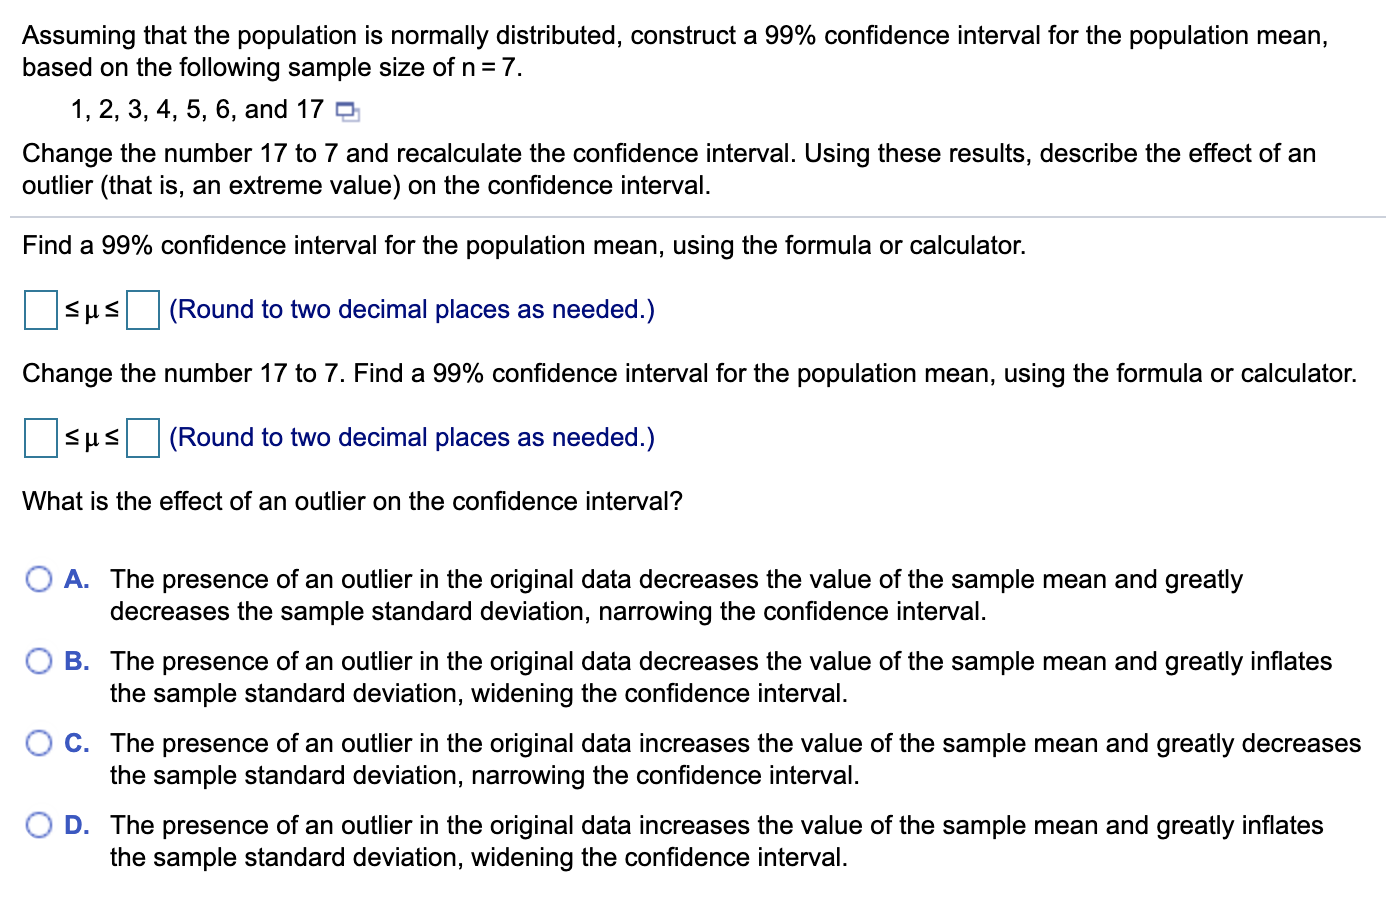
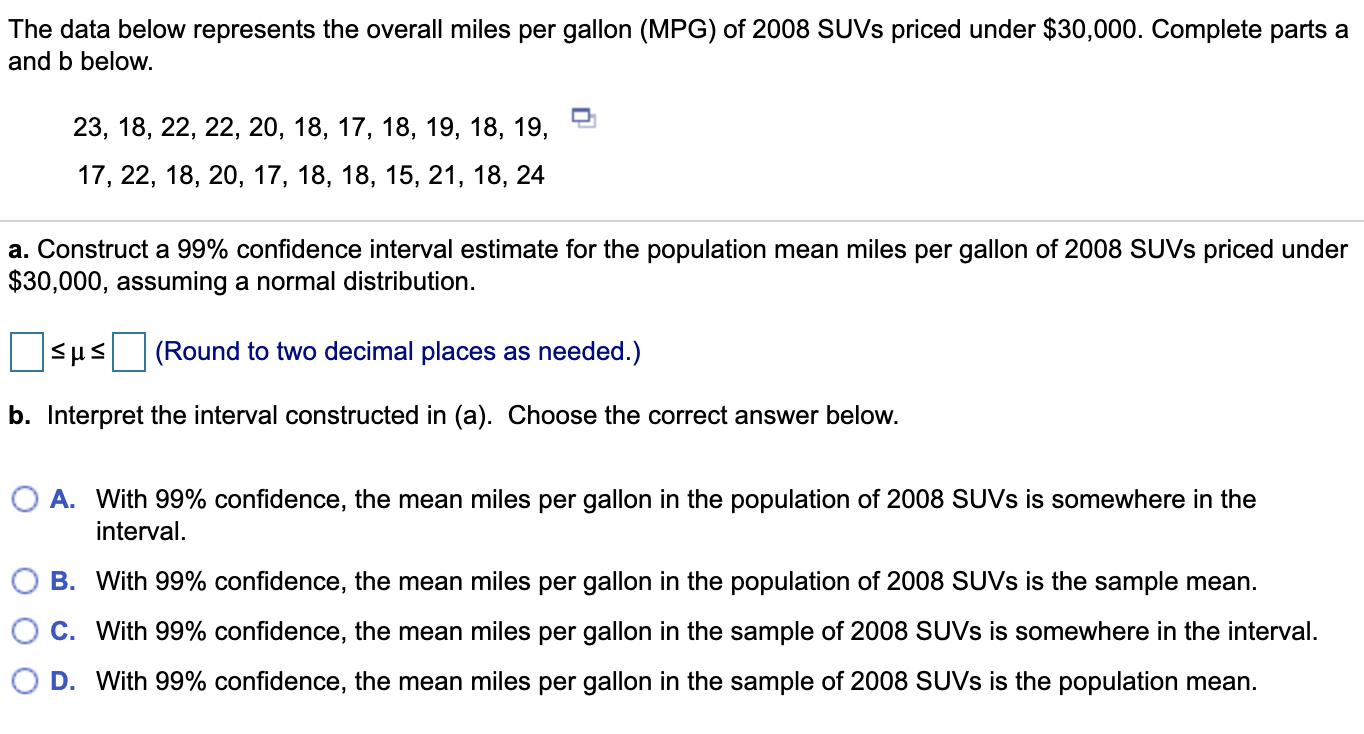
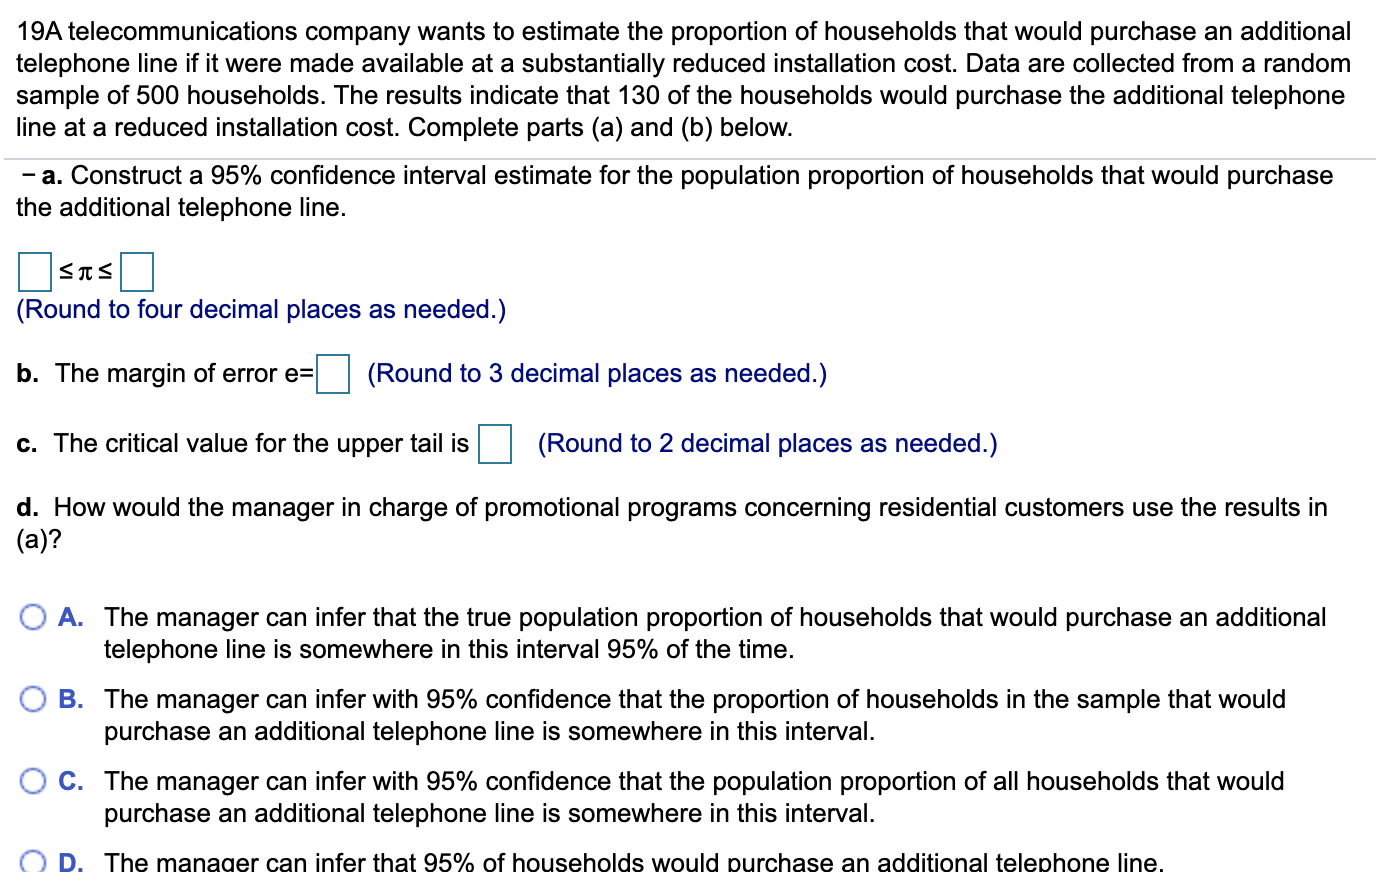
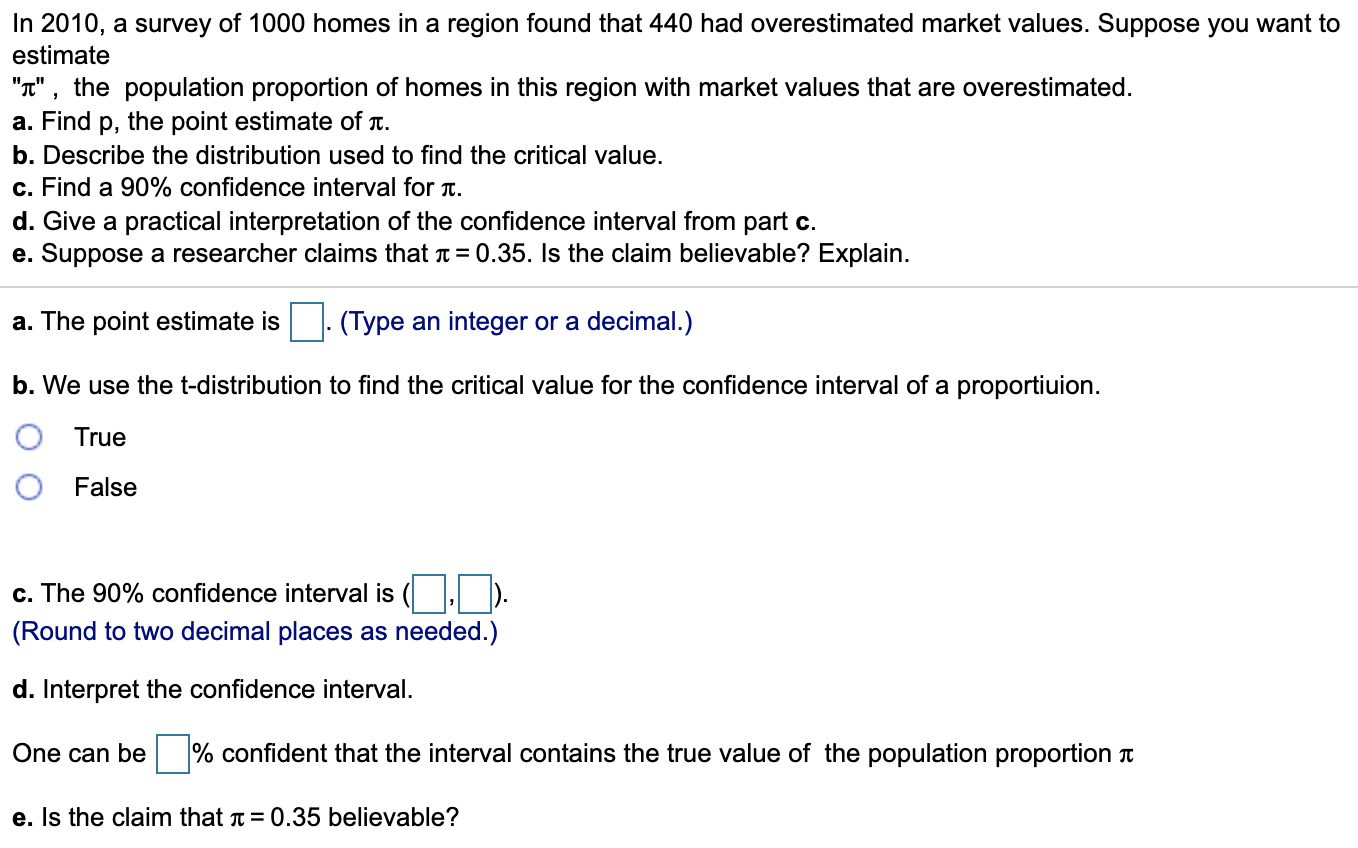
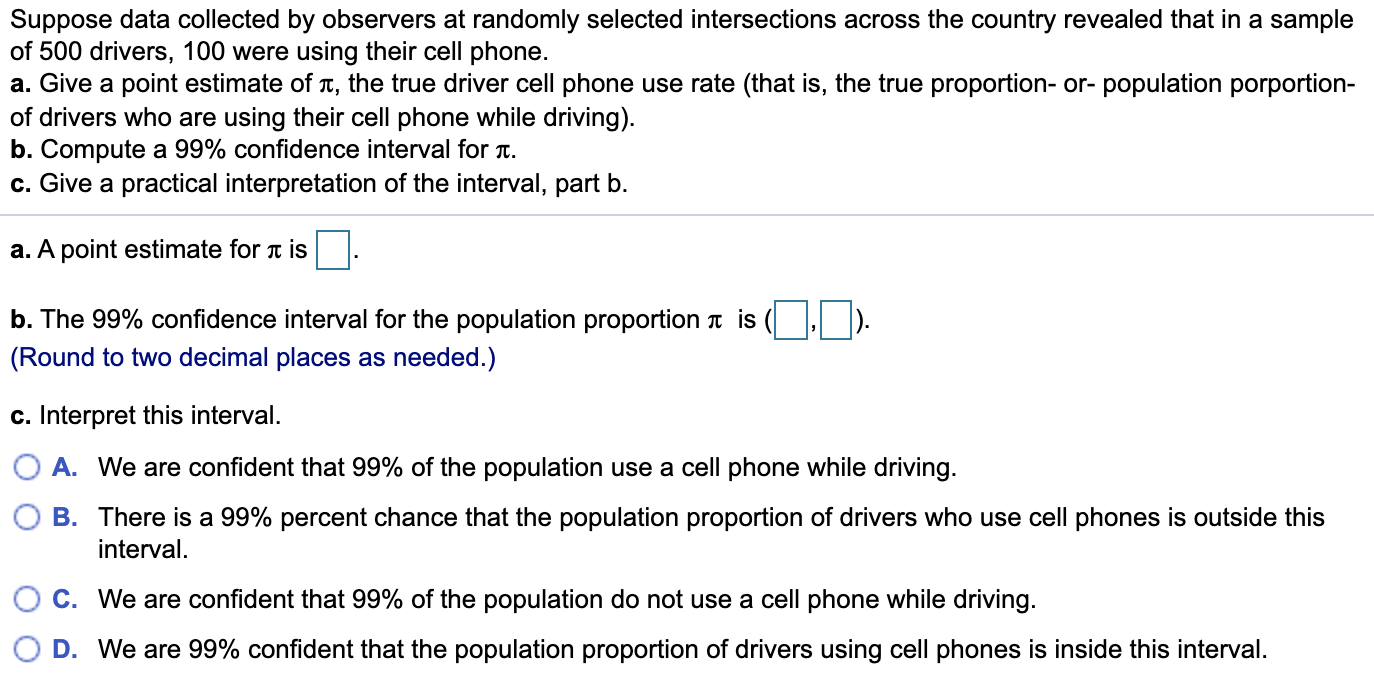
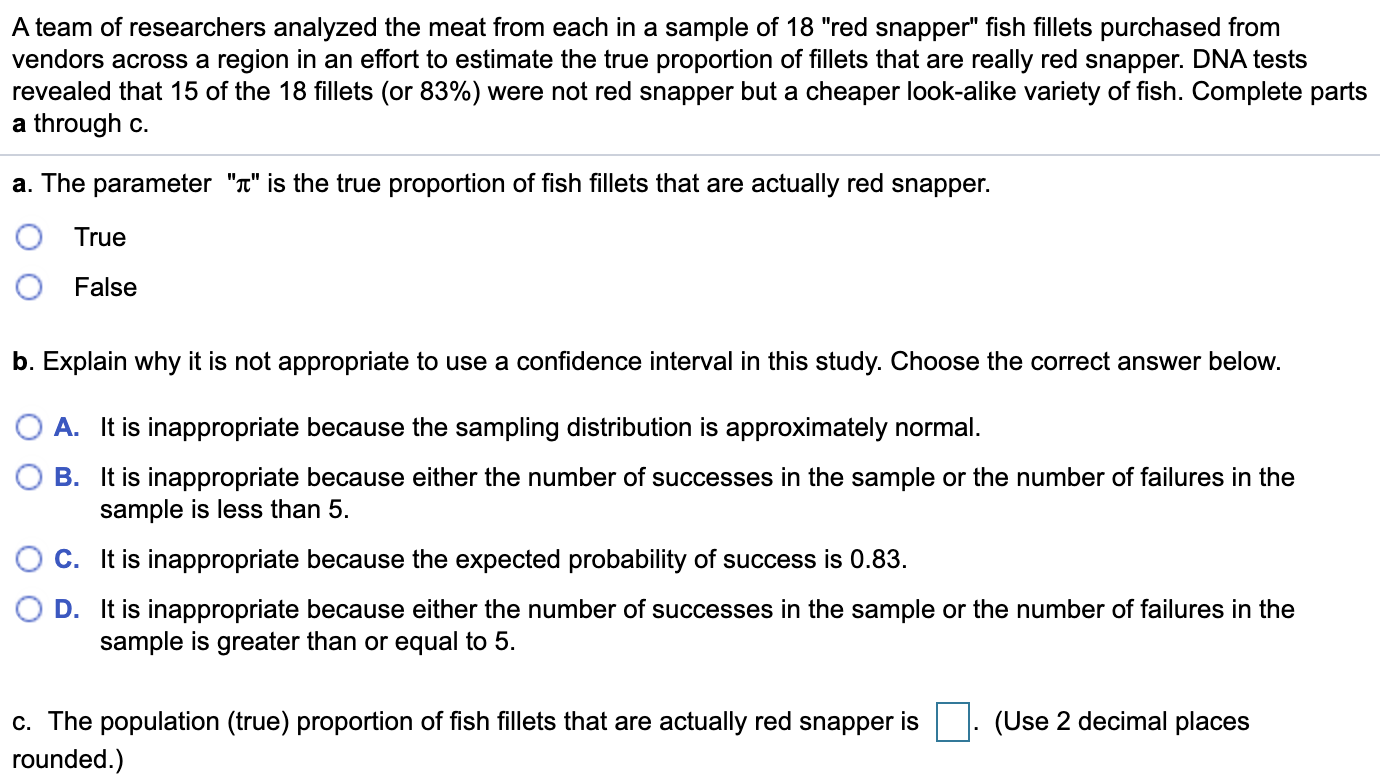
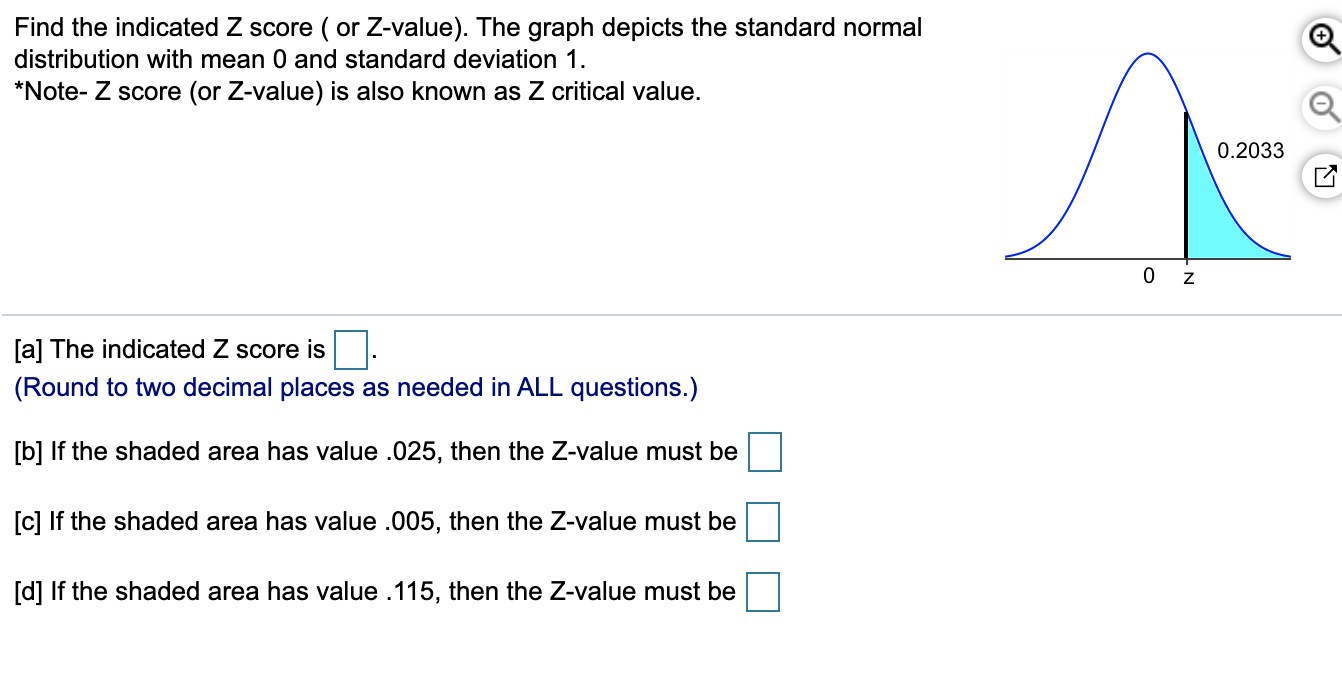
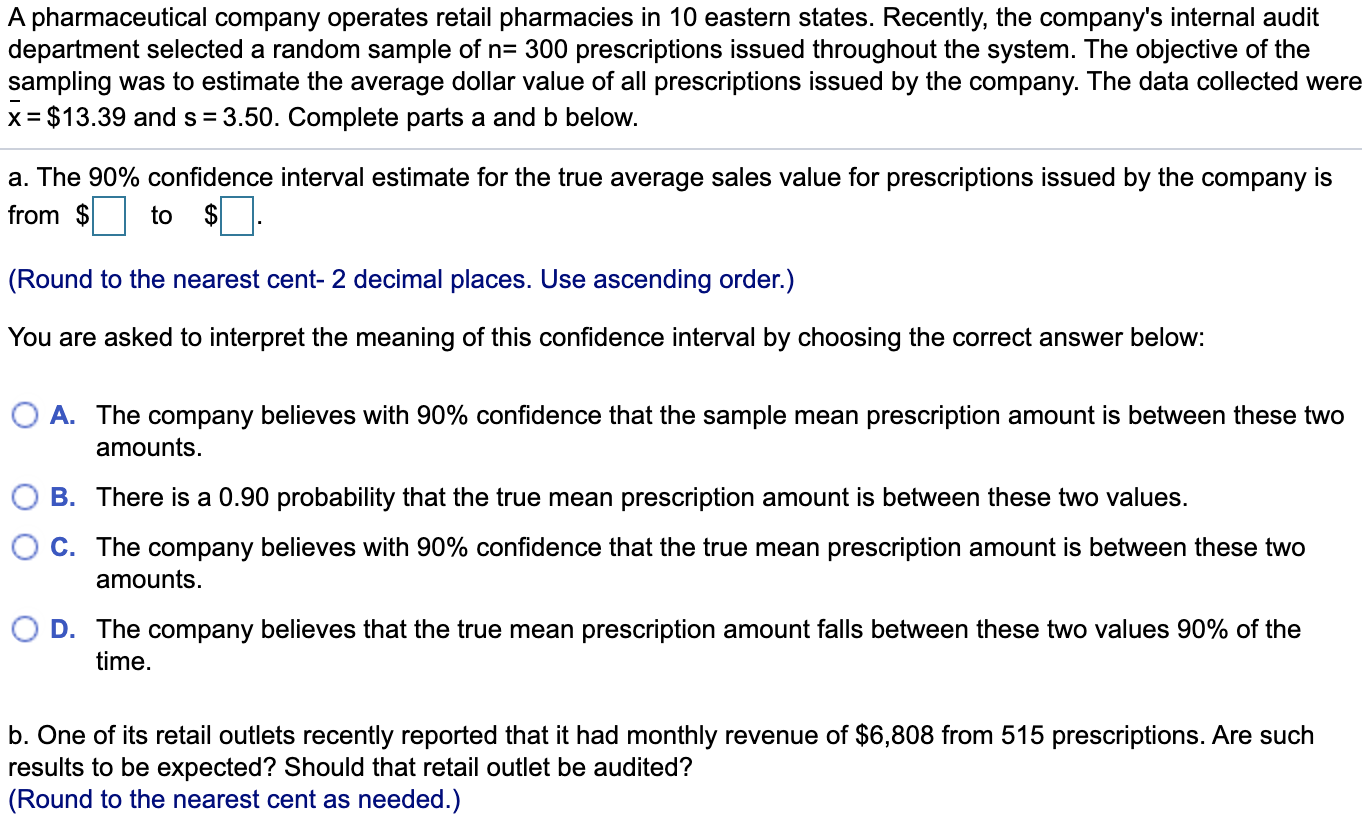
Assuming that the population is normally distributed, construct a 99% confidence interval for the population mean, based on the following sample size of n = 7. 1, 2, 3, 4, 5, 6, and 17 Change the number 17 to 7 and recalculate the confidence interval. Using these results, describe the effect of an outlier (that is, an extreme value) on the confidence interval. Find a 99% confidence interval for the population mean, using the formula or calculator. SUS (Round to two decimal places as needed.) Change the number 17 to 7. Find a 99% confidence interval for the population mean, using the formula or calculator. SHS (Round to two decimal places as needed.) What is the effect of an outlier on the confidence interval? O A. The presence of an outlier in the original data decreases the value of the sample mean and greatly decreases the sample standard deviation, narrowing the confidence interval. O B. The presence of an outlier in the original data decreases the value of the sample mean and greatly inflates the sample standard deviation, widening the confidence interval. O C. The presence of an outlier in the original data increases the value of the sample mean and greatly decreases the sample standard deviation, narrowing the confidence interval. O D. The presence of an outlier in the original data increases the value of the sample mean and greatly inflates the sample standard deviation, widening the confidence interval.The data below represents the overall miles per gallon (MPG) of 2008 SUVs priced under $30,000. Complete parts a and b below. 23, 18, 22, 22, 20, 18, 17, 18, 19, 18, 19, 17, 22, 18, 20, 17, 18, 18, 15, 21, 18, 24 a. Construct a 99% confidence interval estimate for the population mean miles per gallon of 2008 SUVs priced under $30,000, assuming a normal distribution. SHS (Round to two decimal places as needed.) b. Interpret the interval constructed in (a). Choose the correct answer below. O A. With 99% confidence, the mean miles per gallon in the population of 2008 SUVs is somewhere in the interval. O B. With 99% confidence, the mean miles per gallon in the population of 2008 SUVs is the sample mean. O C. With 99% confidence, the mean miles per gallon in the sample of 2008 SUVs is somewhere in the interval. O D. With 99% confidence, the mean miles per gallon in the sample of 2008 SUVs is the population mean.19A telecommunications company wants to estimate the proportion of households that would purchase an additional telephone line if it were made available at a substantially reduced installation cost. Data are collected from a random sample of 500 households. The results indicate that 130 of the households would purchase the additional telephone line at a reduced installation cost. Complete parts (a) and (b) below. - a. Construct a 95% condence interval estimate for the population proportion of households that would purchase the additional telephone line. DSnsD (Round to four decimal places as needed.) b. The margin of error e=|j (Round to 3 decimal places as needed.) c. The critical value for the upper tail is El (Round to 2 decimal places as needed.) d. How would the manager in charge of promotional programs concerning residential customers use the results in (a)? O A. The manager can infer that the true population proportion of households that would purchase an additional telephone line is somewhere in this interval 95% of the time. 0 B. The manager can infer with 95% condence that the proportion of households in the sample that would purchase an additional telephone line is somewhere in this interval. 0 C. The manager can infer with 95% condence that the population proportion of all households that would purchase an additional telephone line is somewhere in this interval. 0 D. The manager can infer that 95% of households would ourchase an additional telephone line. In 2010, a survey of 1000 homes in a region found that 440 had overestimated market values. Suppose you want to estimate "It" , the population proportion of homes in this region with market values that are overestimated. a. Find p, the point estimate of . b. Describe the distribution used to find the critical value. c. Find a 90% confidence interval for It. d. Give a practical interpretation of the confidence interval from part c. e. Suppose a researcher claims that It = 0.35. Is the claim believable? Explain. a. The point estimate is (Type an integer or a decimal.) b. We use the t-distribution to find the critical value for the confidence interval of a proportion. O True O False c. The 90% confidence interval is ( ) . (Round to two decimal places as needed.) d. Interpret the confidence interval. One can be % confident that the interval contains the true value of the population proportion it e. Is the claim that It = 0.35 believable?Suppose data collected by observers at randomly selected intersections across the country revealed that in a sample of 500 drivers, 100 were using their cell phone. a. Give a point estimate of 11:, the true driver cell phone use rate (that is, the true proportion- or- population porportion- of drivers who are using their cell phone while driving). b. Compute a 99% condence interval for 1:. c. Give a practical interpretation of the interval, part b. a. A point estimate for 1: is El. b. The 99% condence interval for the population proportion 1: is (|:|,E|). (Round to two decimal places as needed.) c. Interpret this interval. 0 A. We are condent that 99% of the population use a cell phone while driving. 0 B. There is a 99% percent chance that the population proportion of drivers who use cell phones is outside this interval. 0 C. We are condent that 99% of the population do not use a cell phone while driving. 0 D. We are 99% condent that the population proportion of drivers using cell phones is inside this interval. A team of researchers analyzed the meat from each in a sample of 18 "red snapper" fish fillets purchased from vendors across a region in an effort to estimate the true proportion of fillets that are really red snapper. DNA tests revealed that 15 of the 18 fillets (or 83%) were not red snapper but a cheaper look-alike variety of fish. Complete parts a through c. a. The parameter "It" is the true proportion of fish fillets that are actually red snapper. O True O False b. Explain why it is not appropriate to use a confidence interval in this study. Choose the correct answer below. O A. It is inappropriate because the sampling distribution is approximately normal. O B. It is inappropriate because either the number of successes in the sample or the number of failures in the sample is less than 5. O C. It is inappropriate because the expected probability of success is 0.83. O D. It is inappropriate because either the number of successes in the sample or the number of failures in the sample is greater than or equal to 5. c. The population (true) proportion of fish fillets that are actually red snapper is (Use 2 decimal places rounded.)Find the indicated Z score ( or Z-value). The graph depicts the standard normal distribution with mean 0 and standard deviation 1. *Note- 2 score (or Zvalue) is also known as Z critical value. [a] The indicated Z score is D. (Round to two decimal places as needed in ALL questions.) [b] If the shaded area has value .025, then the Z-value must be D [c] If the shaded area has value .005, then the Z-value must be D [d] If the shaded area has value .115, then the Zvalue must be |:| 0.2033 9,9 l3}. A pharmaceutical company operates retail pharmacies in 10 eastern states. Recently, the company's internal audit department selected a random sample of n= 300 prescriptions issued throughout the system. The objective of the sampling was to estimate the average dollar value of all prescriptions issued by the company. The data collected were x= $13.39 and s = 3.50. Complete parts a and b below. a. The 90% condence interval estimate for the true average sales value for prescriptions issued by the company is from $D to $D. (Round to the nearest cent- 2 decimal places. Use ascending order.) You are asked to interpret the meaning of this condence interval by choosing the correct answer below: 0 A. The company believes with 90% condence that the sample mean prescription amount is between these two amounts. 0 B. There is a 0.90 probability that the true mean prescription amount is between these two values. 0 C. The company believes with 90% condence that the true mean prescription amount is between these two amounts. 0 D. The company believes that the true mean prescription amount falls between these two values 90% of the time. b. One of its retail outlets recently reported that it had monthly revenue of $6,808 from 515 prescriptions. Are such results to be expected? Should that retail outlet be audited? (Round to the nearest cent as needed.) A pharmaceutical company operates retail pharmacies in 10 eastern states. Recently, the company's internal audit department selected a random sample of n= 300 prescriptions issued throughout the system. The objective of the sampling was to estimate the average dollar value of all prescriptions issued by the company. The data collected were x= $13.39 and s = 3.50. Complete parts a and b below. amounts. 0 B. There is a 0.90 probability that the true mean prescription amount is between these two values. 0 C. The company believes with 90% condence that the true mean prescription amount is between these two amounts. 0 D. The company believes that the true mean prescription amount falls between these two values 90% of the time. b. One of its retail outlets recently reported that it had monthly revenue of $6,808 from 515 prescriptions. Are such results to be expected? Should that retail outlet be audited? (Round to the nearest cent as needed.) When the population mean is at the upper limit of the 90% condence interval computed in part a, the upper limit of the 90% condence interval for the expected total monthly revenue for 515 prescriptions would be $|:|. When the population mean is at the lower limit of the 90% condence interval computed in part a, the lower limit of the 90% condence interval for the expected total monthly revenue for 515 prescriptions would be $D. Since this outlet reported sales of $6,808 from 515 prescriptions, there is |:l reason to believe that this is out of line. The retail outlet E] be audited. Click to select your answer(s) and then click Check Answer. no Q good A pharmaceutical company operates retail pharmacies in 10 eastern states. Recently, the company's internal audit department selected a random sample of n= 300 prescriptions issued throughout the system. The objective of the sampling was to estimate the average dollar value of all prescriptions issued by the company. The data collected wen x= $13.39 and s = 3.50. Complete parts a and b below. amounts. 0 B. There is a 0.90 probability that the true mean prescription amount is between these two values. 0 C. The company believes with 90% condence that the true mean prescription amount is between these two amounts. 0 D. The company believes that the true mean prescription amount falls between these two values 90% of the time. b. One of its retail outlets recently reported that it had monthly revenue of $6,808 from 515 prescriptions. Are such results to be expected? Should that retail outlet be audited? (Round to the nearest cent as needed.) When the population mean is at the upper limit of the 90% condence interval computed in part a, the upper limit of the 90% condence interval for the expected total monthly revenue for 515 prescriptions would be $El. When the population mean is at the lower limit of the 90% condence interval computed in part a, the lower limit of th: 90% condence interval for the expected total monthly revenue for 515 prescriptions would be $|:|. Since this outlet reported sales of $6,808 from 515 prescriptions, there is El reason to believe that this is out of line. The retail outlet |:| be audited. should not Click to select your a click Check Answer. ( should ' | _ _ _
