how do i answer
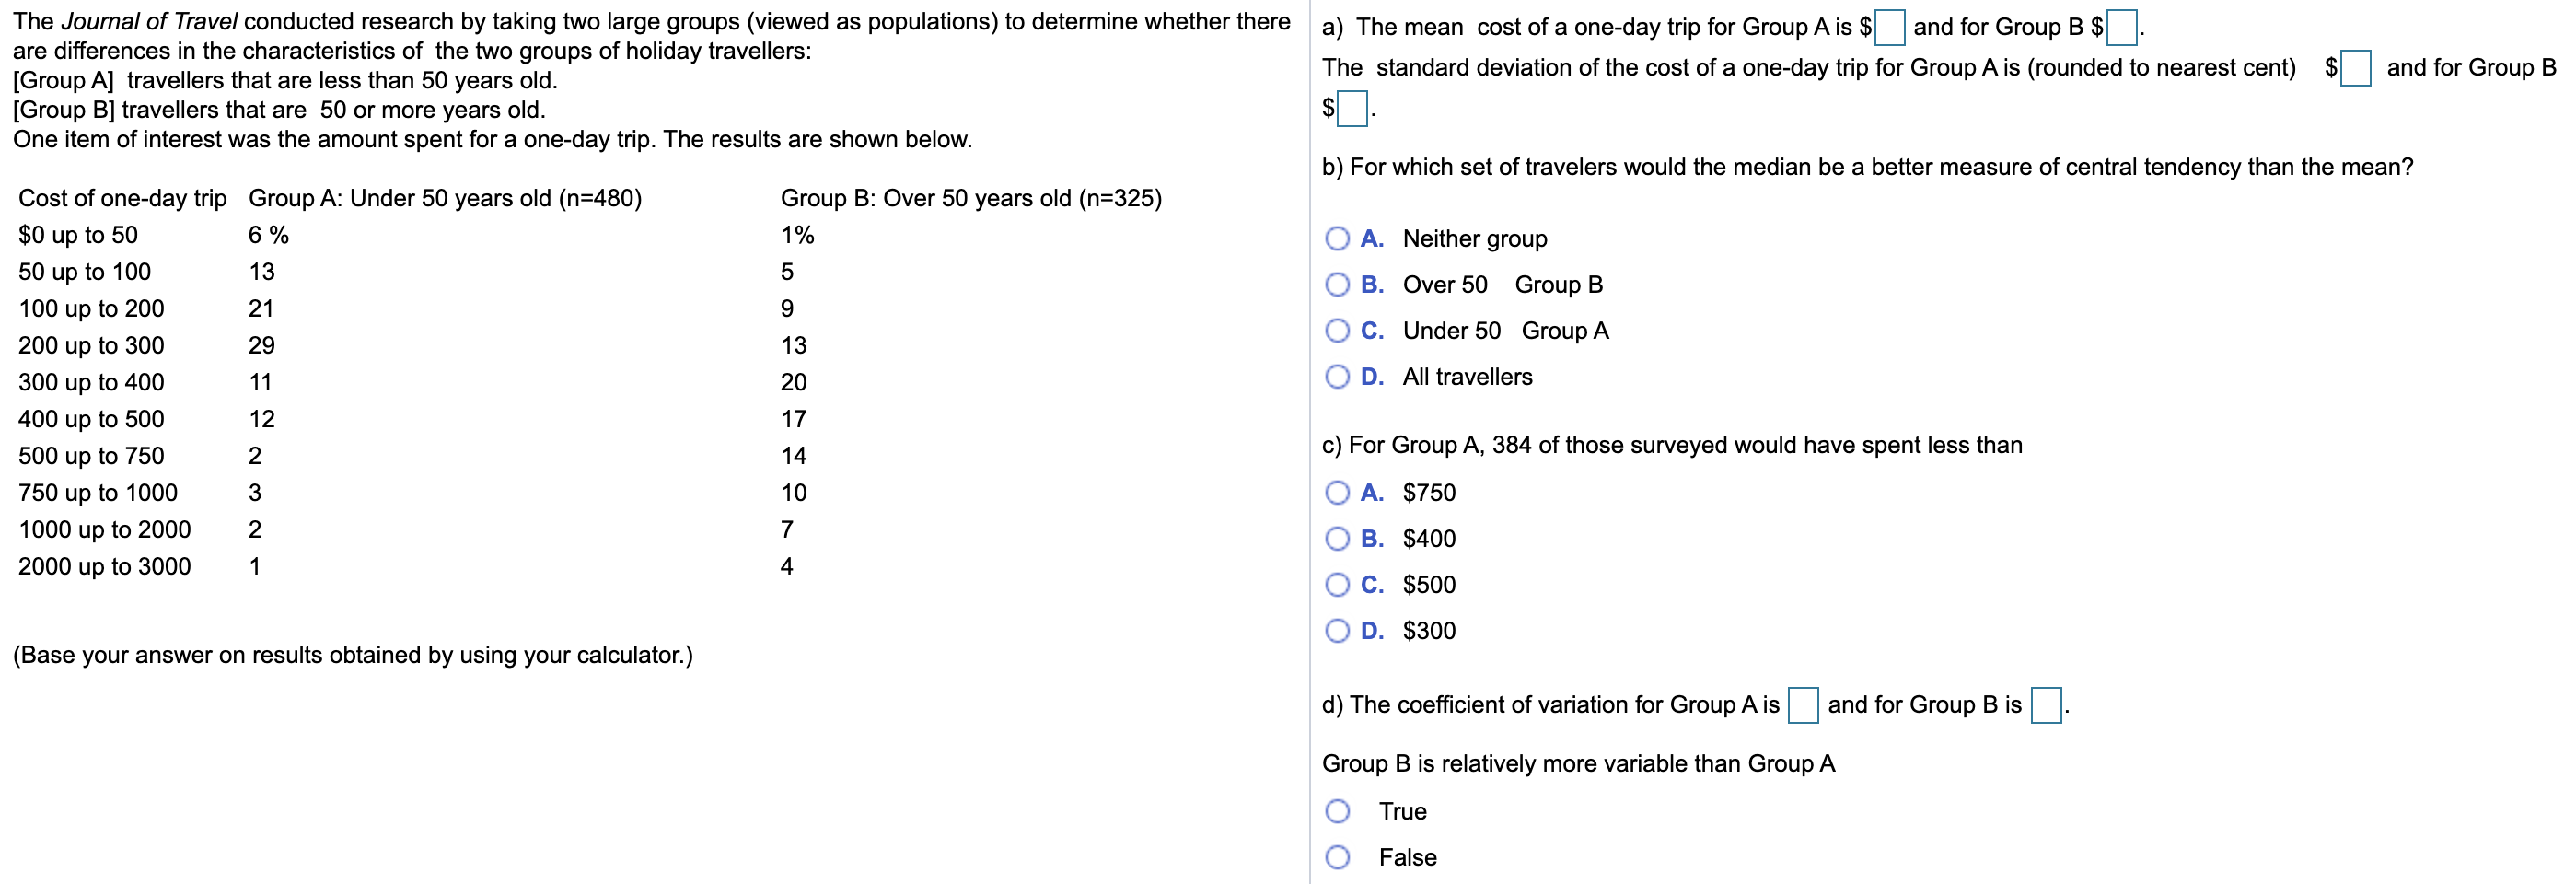
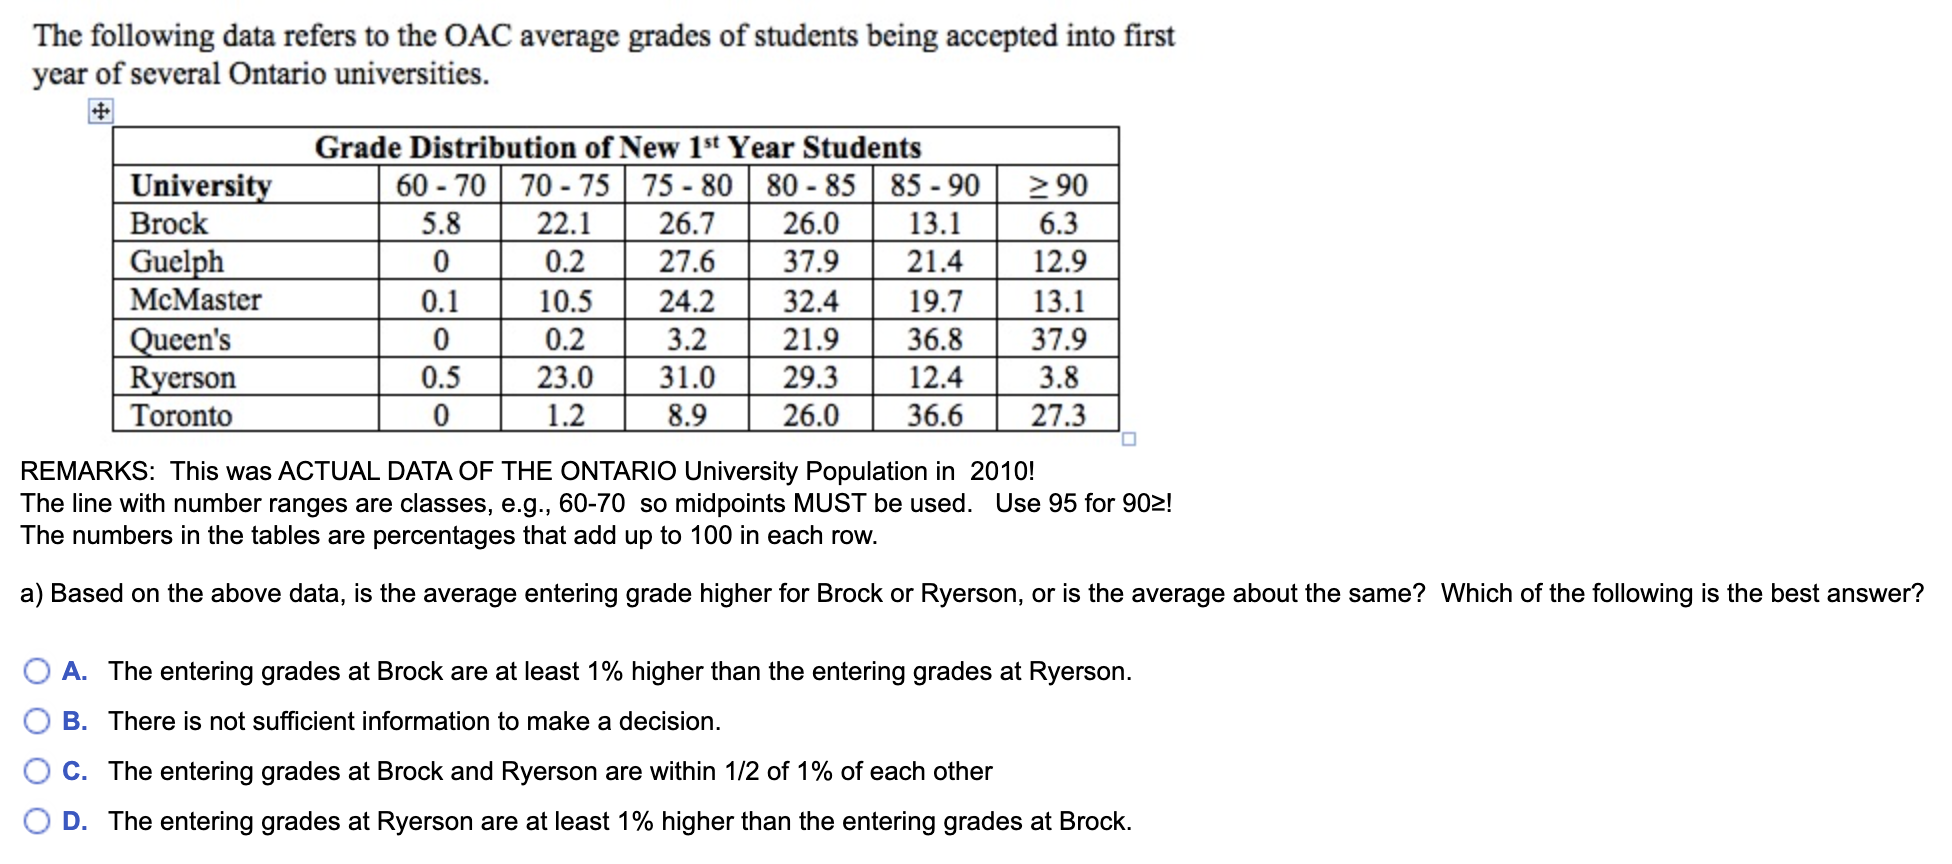
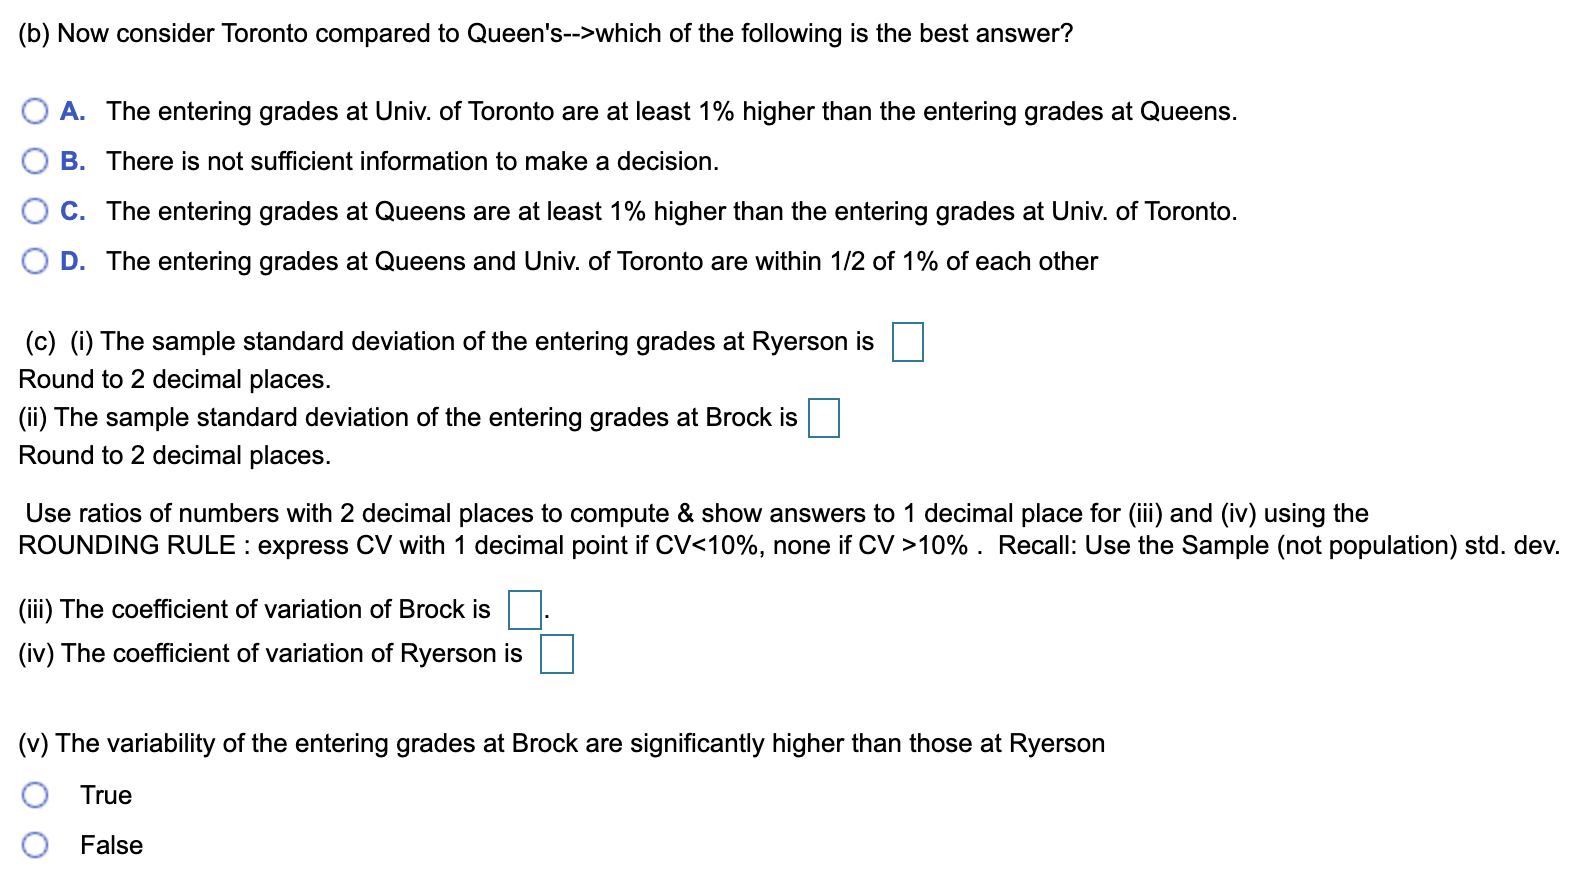
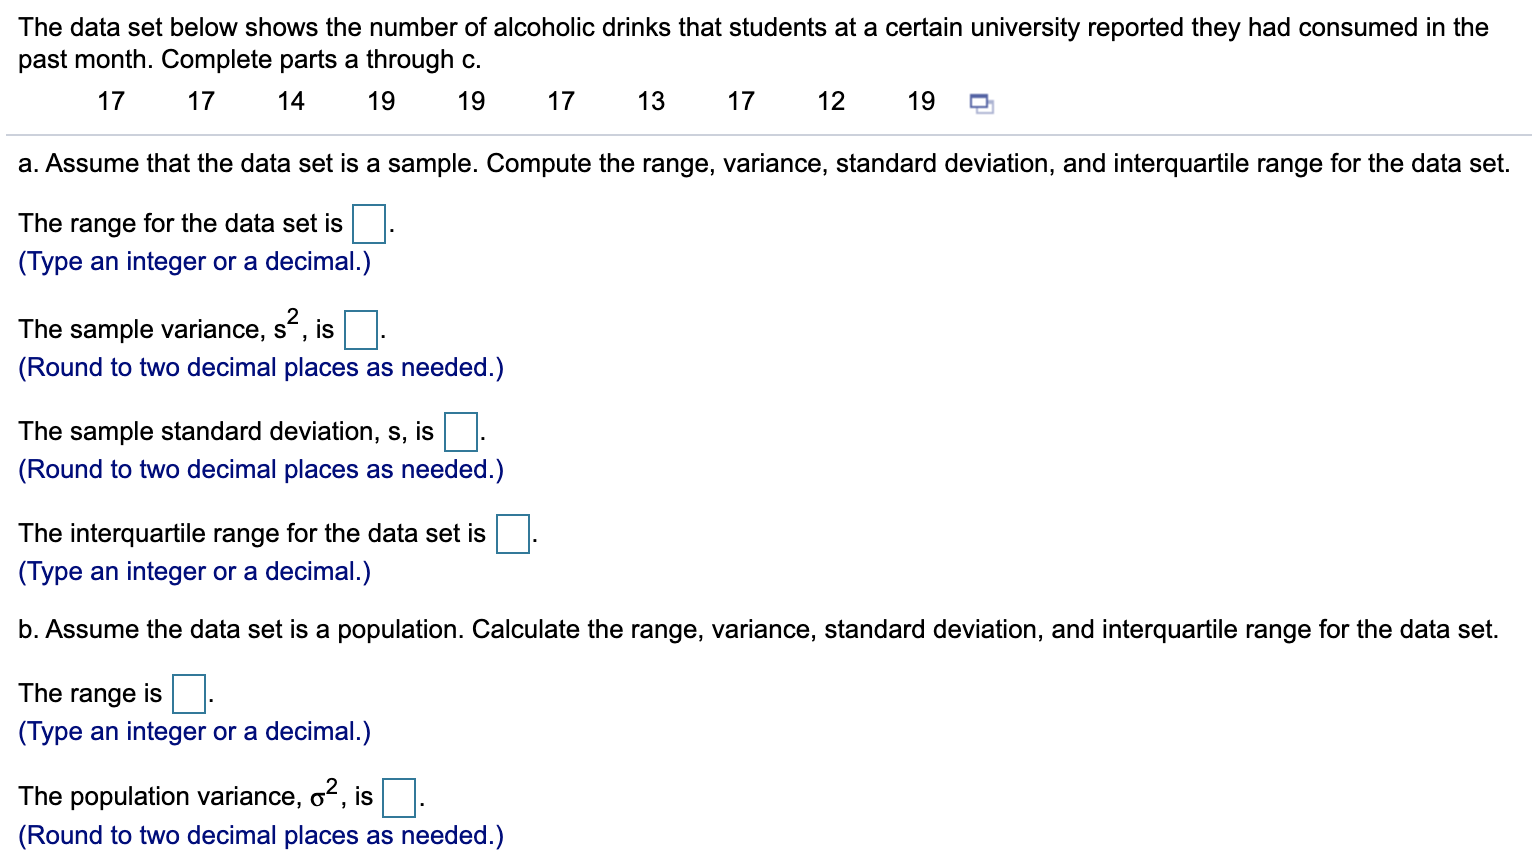
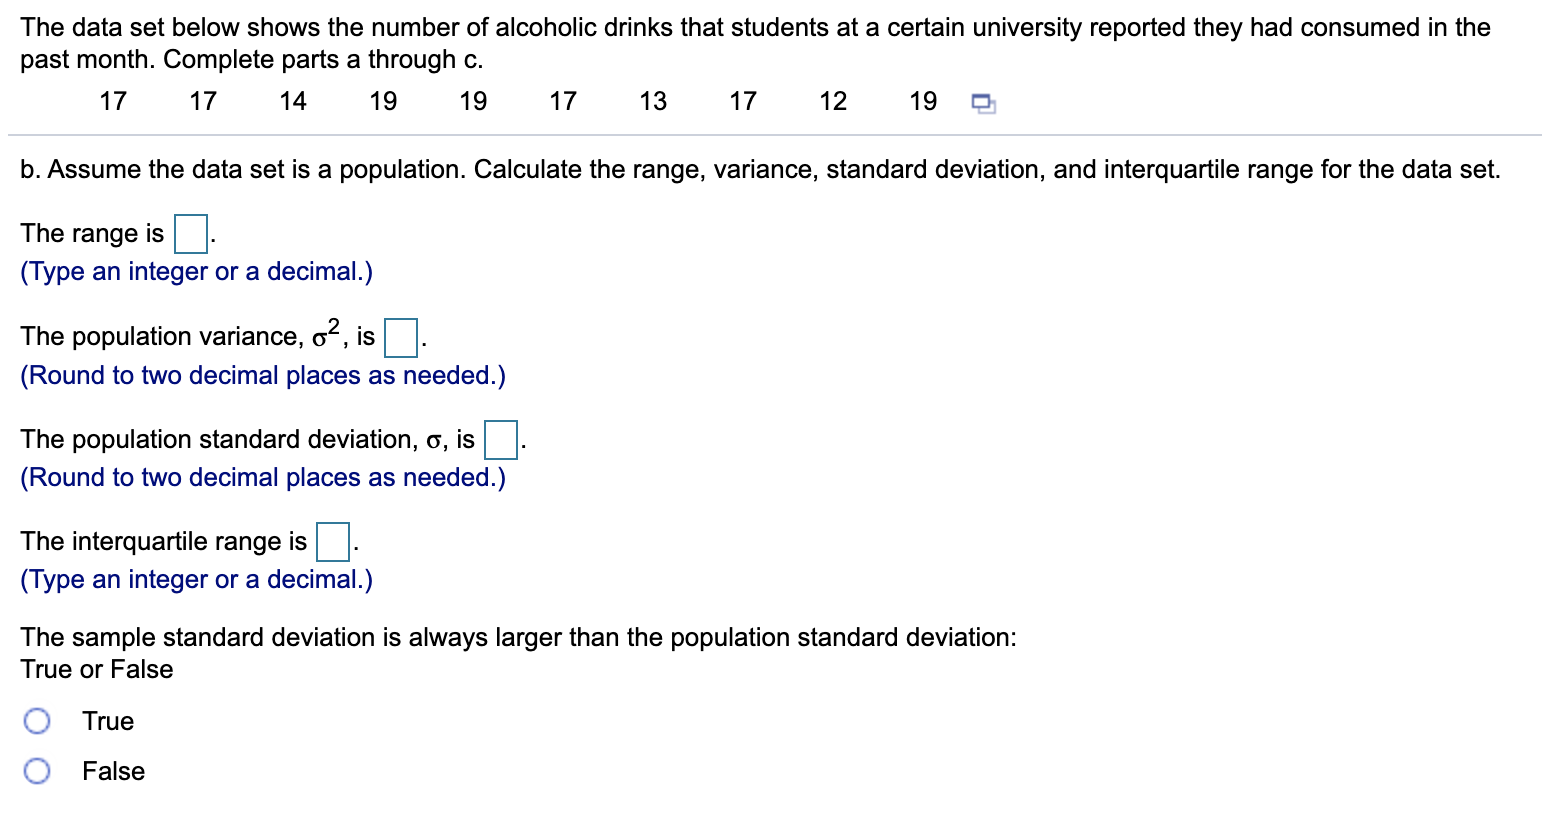
The Journal of Travel conducted research by taking two large groups (viewed as populations) to determine whether there are differences in the characteristics of the two groups of holiday travellers: [Group A] travellers that are less than 50 years old. [Group B] travellers that are 50 or more years old. One item of interest was the amount spent for a one-day trip. The results are shown below. Cost of one-day trip Group A: Under 50 years old (n=480) $0 up to 50 50 up to 100 100 up to 200 200 up to 300 300 up to 400 400 up to 500 500 up to 750 750 up to 1000 1000 up to 2000 2000 up to 3000 (Base your answer on results obtained by using your calculator.) 6% 13 21 Group B: Over 50 years old (n=325) 1 % 5 9 13 20 17 14 10 7 4 a) The mean cost of a one-day trip for Group A is $ and for Group B $ The standard deviation of the cost of a one-day trip for Group A is (rounded to nearest oent) $ $ and for Group B b) For which set of travelers would the median be a better measure of central tendency than the mean? 0 A. Neithergroup O B. Over 50 GroupB O c. Under 50 GroupA O D. All travellers c) For Group A, 384 of those surveyed would have spent less than 0 A. $750 0 B. $400 0 C. $500 0 D. $300 d) The coefcient of variation for Group A is and for Group B is Group B is relatively more variable than Group A 0 True 0 False The following data refers to the OAC average grades of students being accepted into rst year of several Ontario universities. El Gl'ule60 Distribution of New 1" Year Students 70- 75 75- 80 80- 85 mummummi- 27.6 37. 9 El REMARKS: This was ACTUAL DATA OF THE ONTARIO University Population in 2010! The line with number ranges are classes, e.g., 60-70 so midpoints MUST be used. Use 95 for 902! The numbers in the tables are percentages that add up to 100 in each row. a) Based on the above data, is the average entering grade higher for Brock or Ryerson, or is the average about the same? Which of the following is the best answer? 0 A. The entering grades at Brock are at least 1% higher than the entering grades at Ryerson. O B. There is not sufcient information to make a decision. 0 C. The entering grades at Brock and Ryerson are within 1/2 of 1% of each other 0 D. The entering grades at Ryerson are at least 1% higher than the entering grades at Brock. (b) Now consider Toronto compared to Queen's-->which of the following is the best answer? O A. The entering grades at Univof Toronto are at least 1% higher than the entering grades at Queens. O B. There is not sufficient information to make a decision. O C. The entering grades at Queens are at least 1% higher than the entering grades at Univof Toronto. O D. The entering grades at Queens and Univ. of Toronto are within 1/2 of 1% of each other (c) (i) The sample standard deviation of the entering grades at Ryerson is Round to 2 decimal places. (ii) The sample standard deviation of the entering grades at Brock is Round to 2 decimal places. Use ratios of numbers with 2 decimal places to compute & show answers to 1 decimal place for (iii) and (iv) using the ROUNDING RULE : express CV with 1 decimal point if CV10% . Recall: Use the Sample (not population) std. dev. (iii) The coefficient of variation of Brock is (iv) The coefficient of variation of Ryerson is (v) The variability of the entering grades at Brock are significantly higher than those at Ryerson O True O FalseThe data set below shows the number of alcoholic drinks that students at a certain university reported they had consumed in the past month. Complete parts a through c. 1T 1T 14 19 19 17 13 17 12 19 D. a. Assume that the data set is a sample. Compute the range, variance, standard deviation, and interquartile range for the data set. The range for the data set is E. (Type an integer or a decimal.) The sample variance, 52, is D. (Round to two decimal places as needed.) The sample standard deviation, s, is D. (Round to two decimal places as needed.) The interquartile range for the data set is E. (Type an integer or a decimal.) b. Assume the data set is a population. Calculate the range, variance, standard deviation, and interquartile range for the data set. The range is E. (Type an integer or a decimal.) The population variance, (:2, is D. (Round to two decimal places as needed.) The data set below shows the number of alcoholic drinks that students at a certain university reported they had consumed in the past month. Complete parts a through c. 17 17 14 19 19 17 13 17 12 19 D. b. Assume the data set is a population. Calculate the range, variance, standard deviation, and interquartile range for the data set. The range is E. (Type an integer or a decimal.) The population variance, (:2. is El. (Round to two decimal places as needed.) The population standard deviation, 6, is D. (Round to two decimal places as needed.) The interquartile range is E. (Type an integer or a decimal.) The sample standard deviation is always larger than the population standard deviation: True or False 0 True 0 False