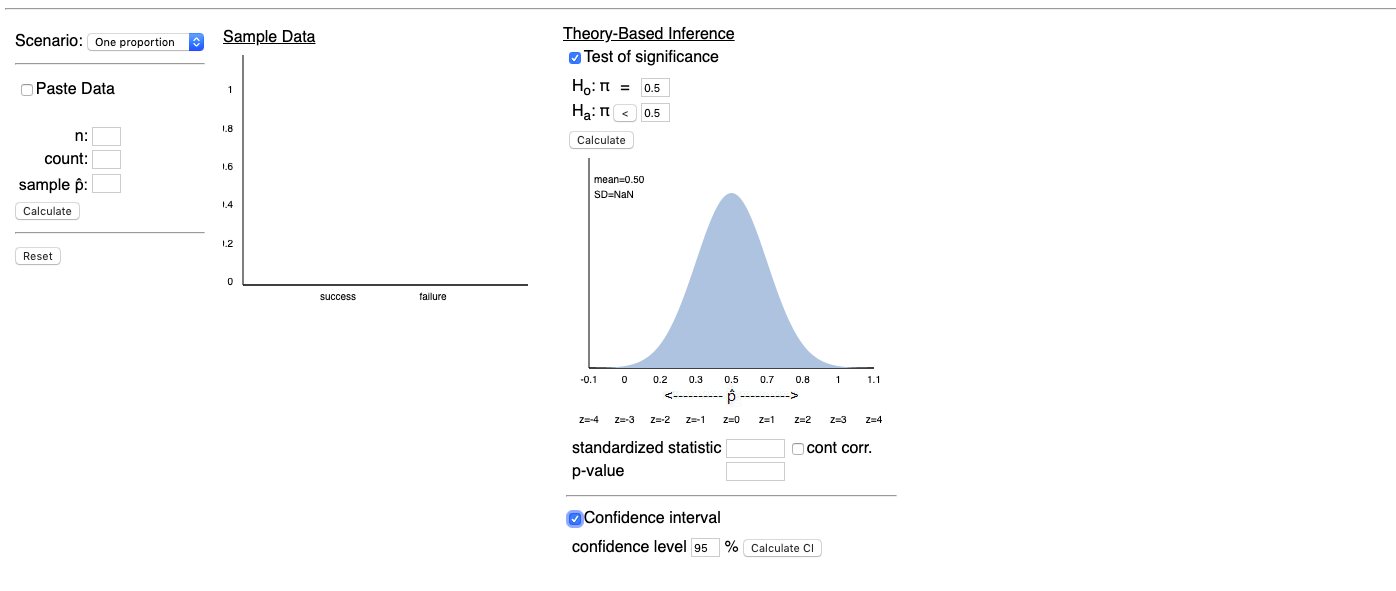
How do I apply to the applet? I am confused as to how to get the test statistic.
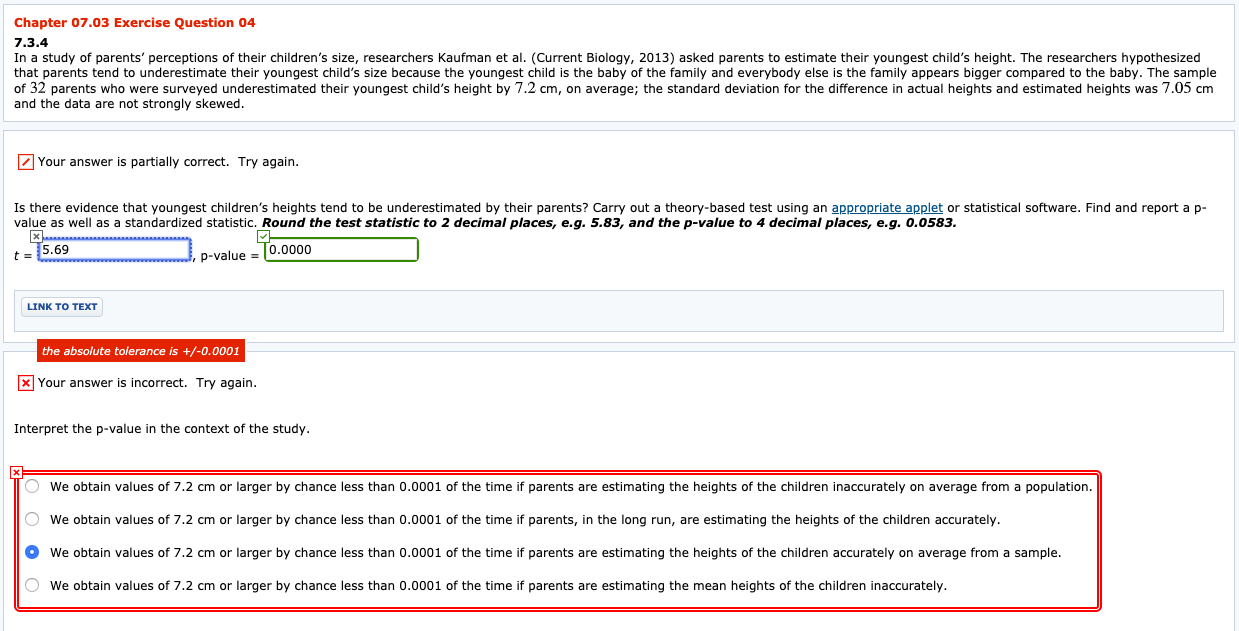
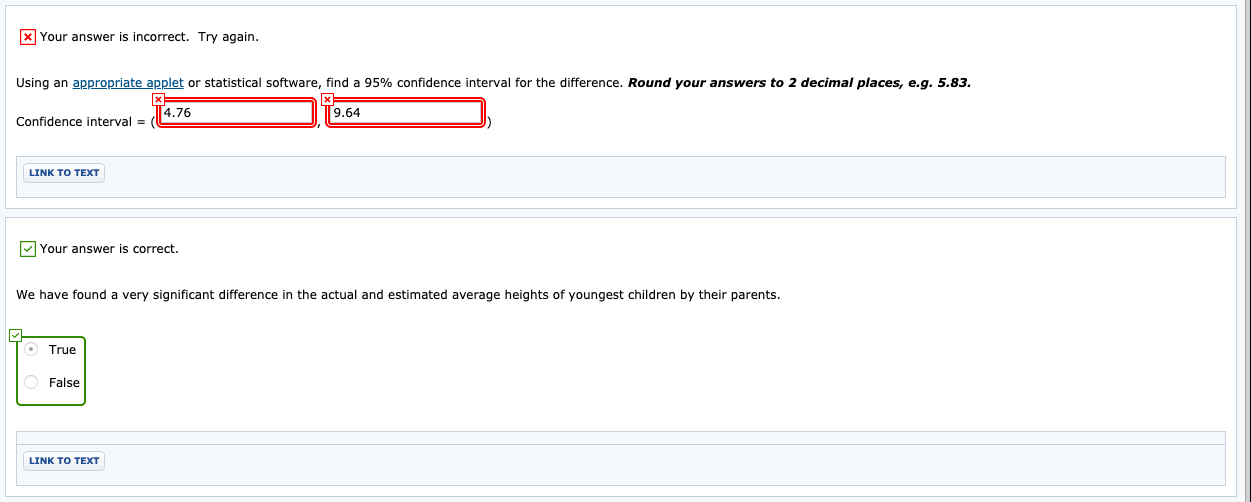
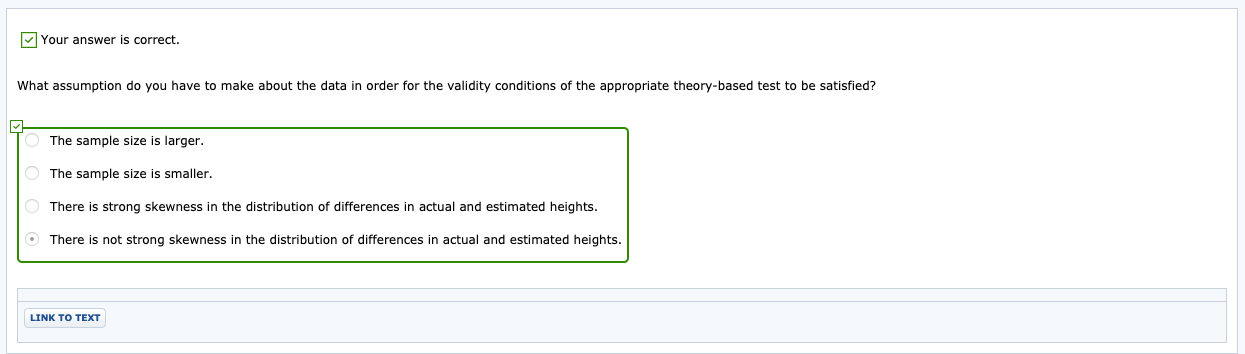
Chapter 07.03 Exerclse Question 04 7.3.4 In a study of parents' perceptions of their children's size, researchers Kaufman et al. (Current Biology, 2013) asked parents to estimate their youngest child's height. The researchers hypothesized that parenE tend to underestimate their youngest child's size because the youngest child is the baby of the family and everybody else is the family appears bigger compared to the baby. 111a sample of '32 parenls who were surveyed underestimated their youngwt child's height by 7.2 cm, on average; the standard deviation for the difference in actual heights and estimated heights was 7.05 cm and the data are not strongly skewed. / Your answer is partially correct. Try again. value as well as a standardized statistic. Round the Marshals-dc to 2 decimal places, em. 5.83, and the p-vaiue to 4 declma! places, e.g. 0.0583. .- a_,.......- mono LINK TO TEXT the absolute tolerance ' fr 0. 0001 x Your answer is incorrect. Try again. IntJerpret the p-value in the context of the study. CI We obtain values of 7.2 cm or larger by chance less than 0.0001 of the time if parents are estimating the heights of the children inaccurately on average from a population. CI We obtain values of 7.2 cm or larger by chance less than 0.0001 of the time if parents. in the long run, are estimating the heights of the children accurately. 0 We obtain values of 7.2 cm or larger by chance less than 0.0001 of the time if parents are estimating the heights of the children accurately on average from a sample. C- We obtain values of 7.2 cm or larger by chance less than 0.0001 of the time if parents are estimating the mean heights of the children inaccurately. x Your answer is incorrect. Try again. Using an appropriate applet or statistical software, find a 95% confidence interval for the difference. Round your answers to 2 decimal places, e.g. 5.83. x x Confidence interval = 4.76 9.64 LINK TO TEXT Your answer is correct. We have found a very significant difference in the actual and estimated average heights of youngest children by their parents. True O False LINK TO TEXTYour answer is correct. What assumption do you have to make about the data in order for the validity conditions of the appropriate theory-based test to be satisfied? The sample size is larger. O The sample size is smaller. O There is strong skewness in the distribution of differences in actual and estimated heights. There is not strong skewness in the distribution of differences in actual and estimated heights. LINK TO TEXTScenario: One proportion E Sample Data Theory-Based Inference Test of significance O Paste Data Ho: IT = 0.5 Ha: IT