How do I calculate the growth rate for Facebook? How do I forecast for Year +1, Year +2, Year +3 (please show the formula) for Facebook Inc. Revenue, Income from Operations, and Net Income? (Assumption: Industry Growth Average 16.8%)
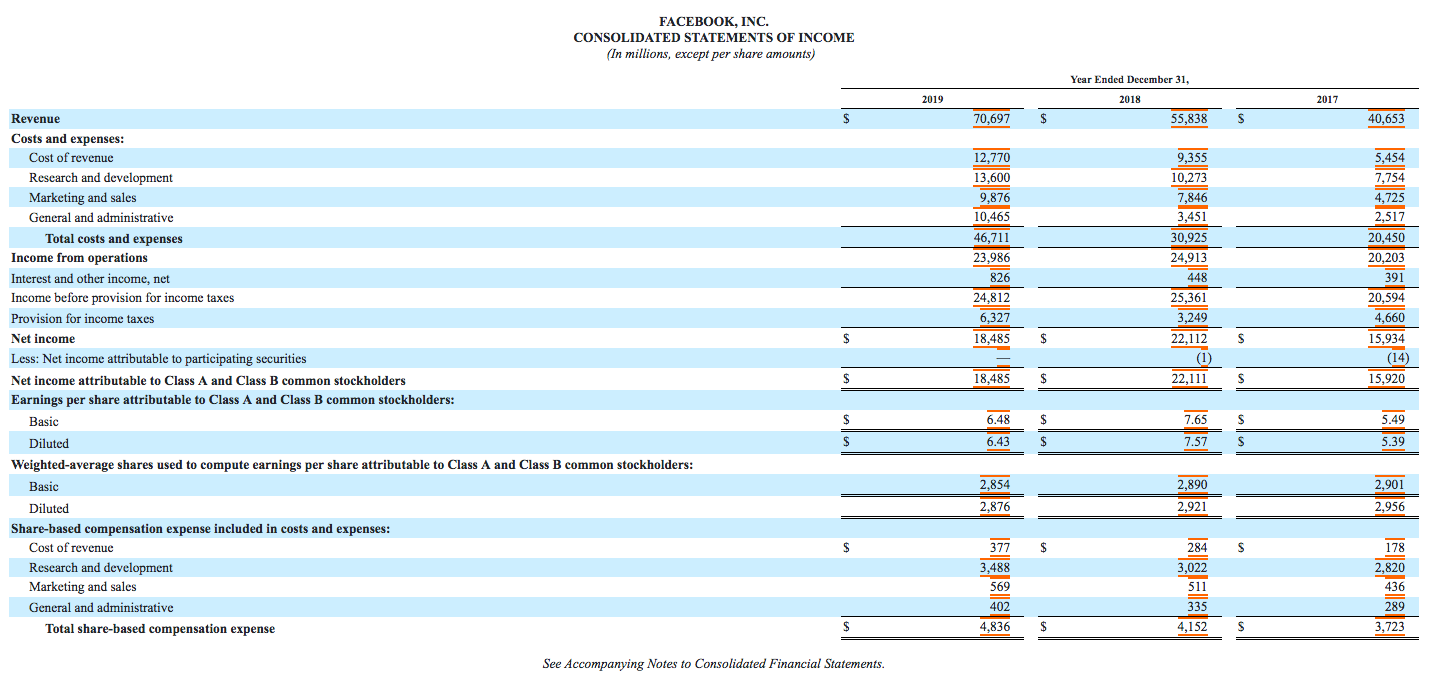
FACEBOOK, INC. CONSOLIDATED STATEMENTS OF INCOME (In millions, except per share amounts) Year Ended December 31, 2019 2018 2017 $ 70,697 $ 55,838 S 40,653 12.770 13,600 9,876 10,465 46,711 23,986 826 24,812 6,327 18,485 9,355 10,273 7,846 3,451 30,925 24,913 5,454 7,754 4,725 2,517 20,450 20,203 391 20,594 4,660 15,934 (14) 15,920 448 25,361 3,249 22,112 (1) $ $ Revenue Costs and expenses: Cost of revenue Research and development Marketing and sales General and administrative Total costs and expenses Income from operations Interest and other income, net Income before provision for income taxes Provision for income taxes Net income Less: Net income attributable to participating securities Net income attributable to Class A and Class B common stockholders Earnings per share attributable to Class A and Class B common stockholders: Basic Diluted Weighted average shares used to compute earnings per share attributable to Class A and Class B common stockholders: Basic Diluted Share-based compensation expense included in costs and expenses: Cost of revenue Research and development Marketing and sales General and administrative Total share-based compensation expense S $ 18,485 $ 22,111 S $ 6.48 $ 7.65 S 5.49 $ 6.43 $ 7.57 S 5.39 2,854 2,876 2,890 2,921 2,901 2,956 $ $ S 178 377 3,488 284 3,022 2,820 436 569 511 402 335 289 $ 4,836 $ 4,152 S 3,723 See Accompanying Notes to Consolidated Financial Statements. FACEBOOK, INC. CONSOLIDATED STATEMENTS OF INCOME (In millions, except per share amounts) Year Ended December 31, 2019 2018 2017 $ 70,697 $ 55,838 S 40,653 12.770 13,600 9,876 10,465 46,711 23,986 826 24,812 6,327 18,485 9,355 10,273 7,846 3,451 30,925 24,913 5,454 7,754 4,725 2,517 20,450 20,203 391 20,594 4,660 15,934 (14) 15,920 448 25,361 3,249 22,112 (1) $ $ Revenue Costs and expenses: Cost of revenue Research and development Marketing and sales General and administrative Total costs and expenses Income from operations Interest and other income, net Income before provision for income taxes Provision for income taxes Net income Less: Net income attributable to participating securities Net income attributable to Class A and Class B common stockholders Earnings per share attributable to Class A and Class B common stockholders: Basic Diluted Weighted average shares used to compute earnings per share attributable to Class A and Class B common stockholders: Basic Diluted Share-based compensation expense included in costs and expenses: Cost of revenue Research and development Marketing and sales General and administrative Total share-based compensation expense S $ 18,485 $ 22,111 S $ 6.48 $ 7.65 S 5.49 $ 6.43 $ 7.57 S 5.39 2,854 2,876 2,890 2,921 2,901 2,956 $ $ S 178 377 3,488 284 3,022 2,820 436 569 511 402 335 289 $ 4,836 $ 4,152 S 3,723 See Accompanying Notes to Consolidated Financial Statements