Question
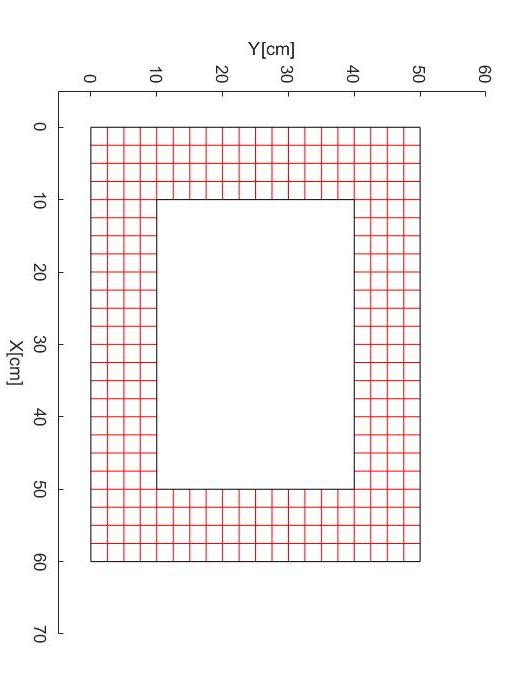
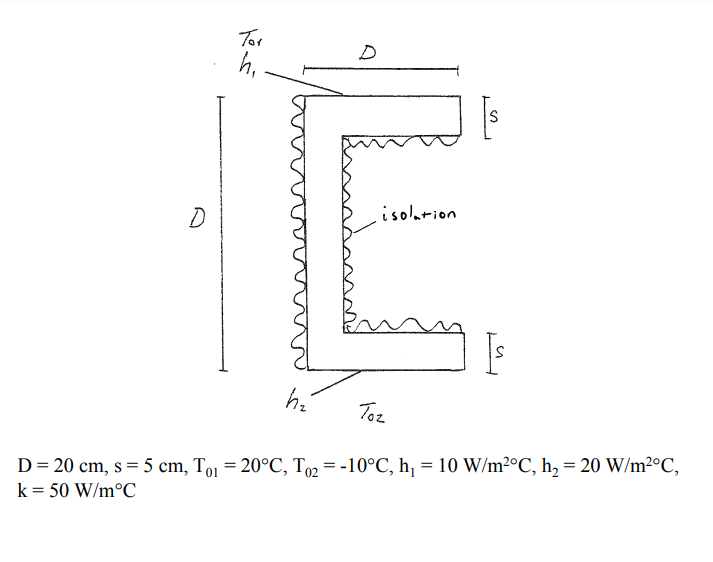
How do I code the meshgrid in Matlab for the picture below so it comes out like the grid in the picture of the square.
How do I code the meshgrid in Matlab for the picture below so it comes out like the grid in the picture of the square. I'm having trouble converting the square to the u-shape.
Here is the code for the square:
%% Given information about the system % the geometry is like a steel square tube or something similar L = 60; % length of the square [cm] B = 50 ; % sidelength of the square [cm] t = 10; % thickness of the square h_1 = 0.002; %convection coeff [W/cm^2*C] on the outside of the square h_2 = 0.0005; % inner convection coeff k= 0.007; %[W\cm*C] Conduction coeff T_1 = 0; % temp outside of the square T_2 = 100; % temp inside of the square dx = 2.5; % 5 cm between nodes we assume dx=dy
figure hold on %vertical lines in the mesh [m1,n1] = meshgrid(0:dx:L, 0:dx:t); [m2,n2] = meshgrid(0:dx:L, B-t:dx:B); [m3,n3] = meshgrid(0:dx:t, 0:dx:B); [m4,n4] = meshgrid(L-t:dx:L, 0:dx:B); %horizontal lines in the mesh [m5,n5] = meshgrid(t:dx:B-t, 0:dx:t); [m6,n6] = meshgrid(t:dx:B-t, L-t:dx:L); [m7,n7] = meshgrid(0:dx:t, 0:dx:L); [m8,n8] = meshgrid(B-t:dx:B, 0:dx:L); plot(m1,n1,'r') plot(m2,n2,'r') plot(m3,n3,'r') plot(m4,n4,'r') %have to swap m5 and n5 in order to have % them horizontal in plot fucntion plot(n5,m5,'r') plot(n6,m6,'r') plot(n7,m7,'r') plot(n8,m8,'r')
x = [0,0,60,60,0]; y = [0,50,50,0,0]; x2 = [10,10,50,50,10]; y2 = [10,40,40,10,10]; plot(x,y,'k',x2,y2,'k'); axis([-5 70 -5 60]); xlabel('X[cm]') ylabel('Y[cm]') hold off


Step by Step Solution
There are 3 Steps involved in it
Step: 1

Get Instant Access to Expert-Tailored Solutions
See step-by-step solutions with expert insights and AI powered tools for academic success
Step: 2

Step: 3

Ace Your Homework with AI
Get the answers you need in no time with our AI-driven, step-by-step assistance
Get Started


