

Question
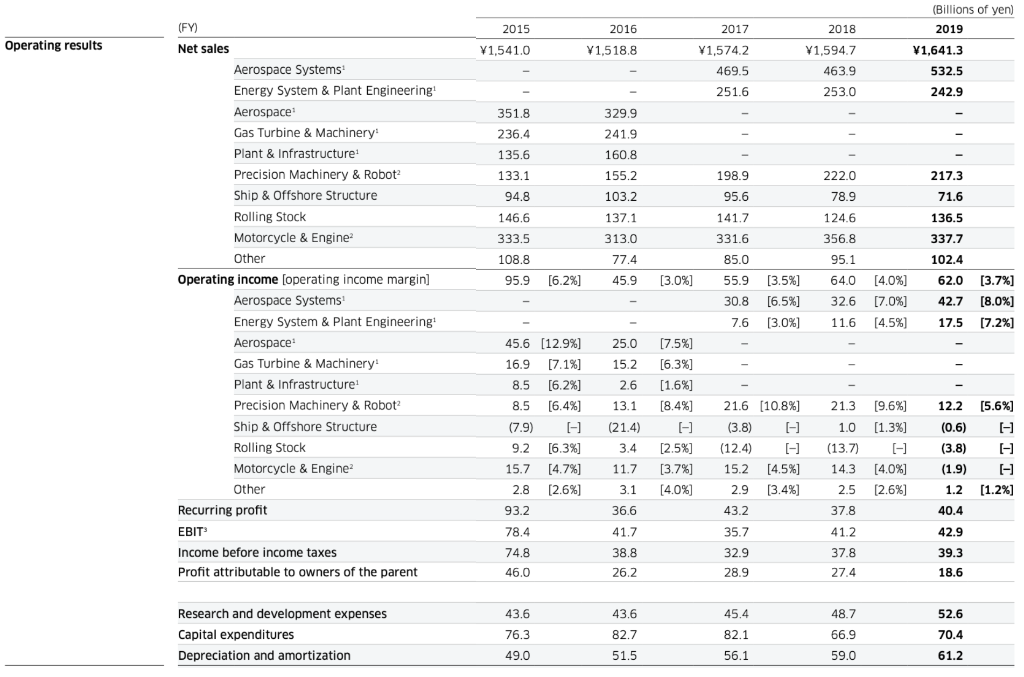
How do I find NET SALES (in EUR) and EBIT% from the screenshots? Need it from 2015-2019. The financial statement is in Japanese YEN. Please
How do I find NET SALES (in EUR) and EBIT% from the screenshots? Need it from 2015-2019. The financial statement is in Japanese YEN. Please use: 1 EUR = 130 JPY Please answer the following: 1. Net Sales (billion EUR) 2. EBIT% 3. Sales by Segments (billion EUR) Please provide an example also so I can learn! Thanks!
Step by Step Solution
There are 3 Steps involved in it
Step: 1

Get Instant Access to Expert-Tailored Solutions
See step-by-step solutions with expert insights and AI powered tools for academic success
Step: 2

Step: 3
Ace Your Homework with AI
Get the answers you need in no time with our AI-driven, step-by-step assistance
Get Started
Modern Auditing Study Guide
Authors: Walter G. Kell
4th Edition
0471619434, 978-0471619437