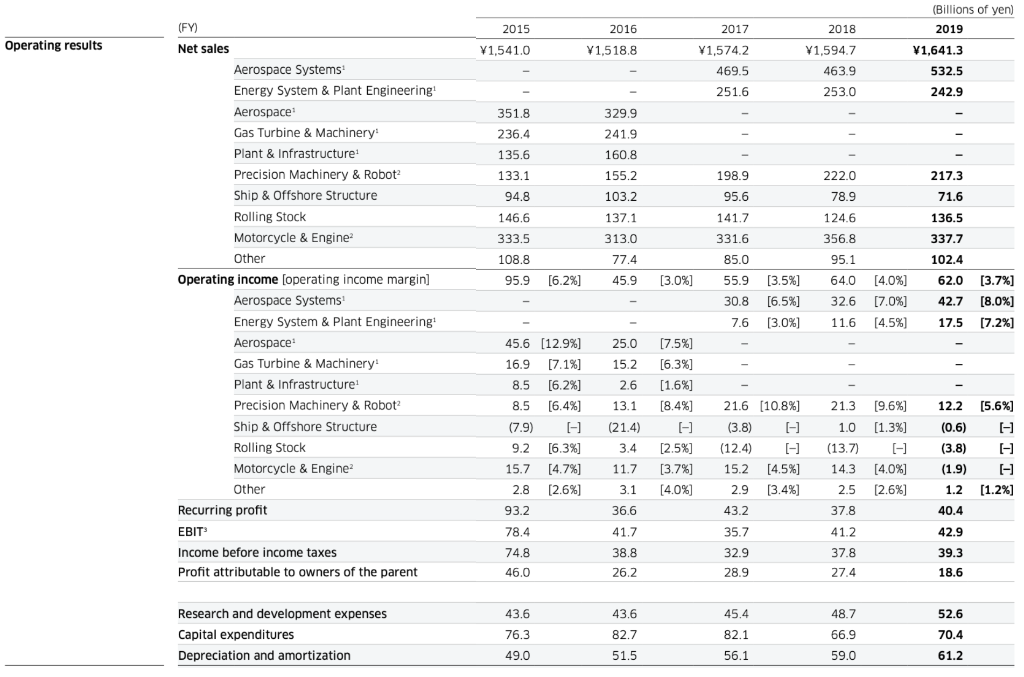
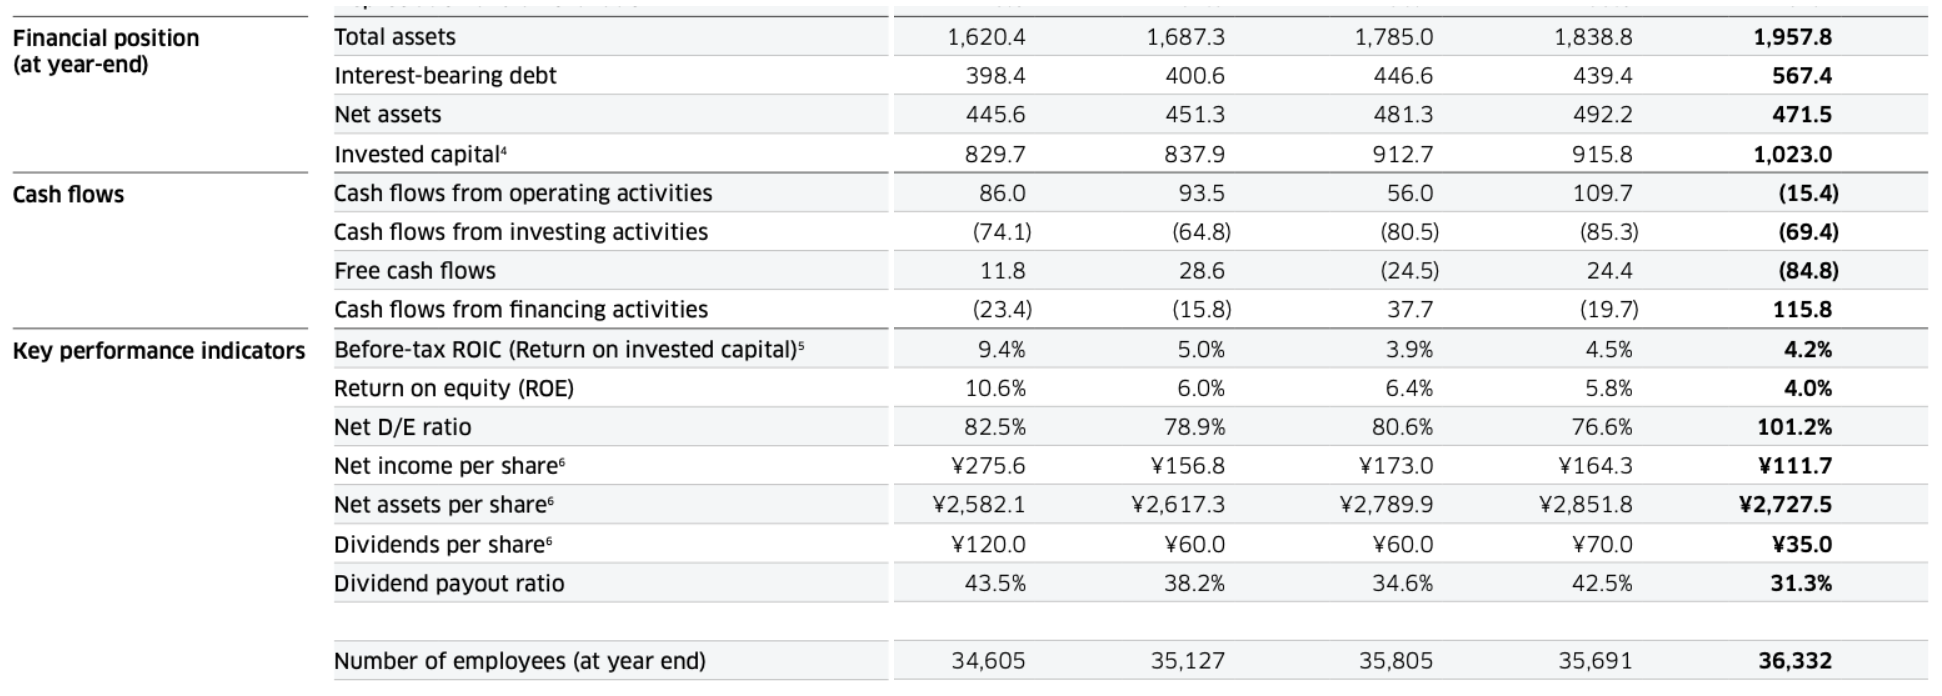
How do I find NET SALES (in EUR) and EBIT% from the screenshots? Need it from 2015-2019. The financial statement is in Japanese YEN. Please use: 1 EUR = 130 JPY Please answer the following: 1. Net Sales (billion EUR) 2. EBIT% 3. Sales by Segments (billion EUR) Please provide an example also so I can learn! Thanks! 

2017 Operating results 2015 1,541.0 2016 V1,518.8 2018 1,594.7 V1,574.2 (Billions of yen) 2019 1,641.3 532.5 242.9 469.5 463.9 251.6 253.0 351.8 236.4 135.6 329.9 241.9 160.8 155.2 103.2 133.1 198.9 222.0 217.3 94.8 95.6 78.9 71.6 146.6 333.5 137.1 313.0 141.7 331.6 124.6 356.8 136.5 337.7 108.8 95.1 77.4 45.9 85.0 55.9 95.9 [6.2%] [3.0%) 64.0 (FY) ( Net sales Aerospace Systems Energy System & Plant Engineering! Aerospace Gas Turbine & Machinery & Plant & Infrastructure Precision Machinery & Robot Ship & Offshore Structure Rolling Stock Motorcycle & Engine Other Operating income [operating income margin] Aerospace Systems Energy System & Plant Engineering Aerospace Gas Turbine & Machinery Plant & Infrastructure Precision Machinery & Robot Ship & Offshore Structure Rolling Stock Motorcycle & Engine Other Recurring profit EBIT Income before income taxes Profit attributable to owners of the parent [3.5%] [6.5%] [3.0%) 30,8 102.4 62.0 (3.7%] 42.7 [8.0%] 17.5 [7.2%] [4.0%) [7.0%) [4.5%) 32.6 11.6 7.6 25.0 15.2 2.6 13.1 12.2 45.6 [12.9%) 16.9 [7.1%] 8.5 [6.2%] 8.5 [6.4%) (7.9) [-] 9.2 [6.3%] 15.7 [4.7%] 2.8 [2.6%] [7.5%] [6.3%] (1.6%] [8.4%) [-] [2.5%] [3.7%] [4.0%) (21.4) 3.4 21.6 (10.8%) (3.8) [-] (12.4) [-] 15.2 [4.5%) 2.9 [3.4%) 21.3 [9.6%) 1.0 (1.3%) (13.7) [-] 14.3 [4.0%) 2.5 (2.6%) [5.6%) I- A [-] (1.2%) 11.7 3.1 (0.6) (3.8) (1.9) 1.2 40.4 42.9 39.3 18.6 36.6 43.2 37.8 41.7 35.7 93.2 78.4 74.8 46.0 38.8 26.2 32.9 28.9 41.2 37.8 27.4 43.6 43,6 45.4 Research and development expenses Capital expenditures Depreciation and amortization 76.3 82.1 82.7 51.5 48.7 66.9 59.0 52.6 70.4 61.2 49.0 56.1 1,620.4 1,687.3 1,785.0 1,957.8 1,838.8 439.4 398.4 400.6 446.6 567.4 445.6 451.3 481.3 492.2 471.5 829.7 837.9 912.7 915.8 86.0 93.5 109.7 (85.3) (74.1) 11.8 56.0 (80.5) (24.5) (64.8) 28.6 Financial position Total assets (at year-end) Interest-bearing debt Net assets Invested capital Cash flows Cash flows from operating activities Cash flows from investing activities Free cash flows Cash flows from financing activities Key performance indicators Before-tax ROIC (Return on invested capitals Return on equity (ROE) Net D/E ratio Net income per shares Net assets per share Dividends per share Dividend payout ratio 1,023.0 (15.4) (69.4) (84.8) 115.8 24.4 (23.4) (15.8) 37.7 (19.7) 9.4% 5.0% 3.9% 4.5% 4.2% 10.6% 6.0% 6.4% 5.8% 4.0% 82.5% 78.9% 80.6% 76.6% 101.2% 275.6 156.8 173.0 164.3 111.7 2,582.1 2,617.3 2,789.9 2,851.8 2,727.5 120.0 60.0 60.0 V70.0 35.0 43.5% 38.2% 34.6% 42.5% 31.3% Number of employees (at year end) 34,605 35,127 35,805 35,691 36,332


