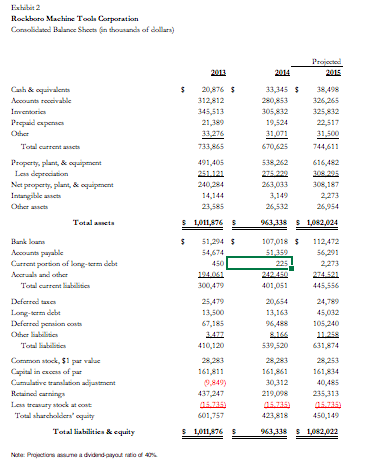
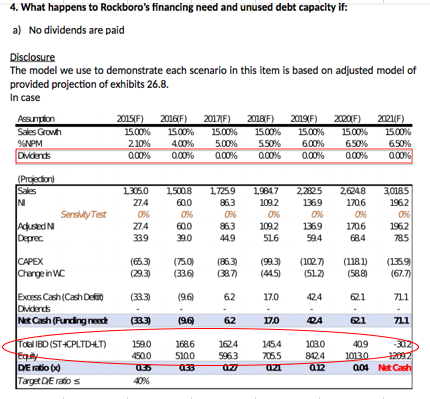
how do I find the D/E ratio? I am confused as to how to get the equity and liabilities in the chart below (i attached the balance sheet for reference) circled in red is what I need help with. Please show all work! Thank you!


Exhibet 2 Rockboro Machine Tools Corporation Comodato Balance Shots Sa thosands of dollara) Projected 2015 $ 20,876 $ 312,812 345,513 21,389 33.276 733.865 491,405 251.121 240,284 33,345 $ 280,853 305,832 19,524 31.071 670,625 538,262 326,265 325,12 22,517 31,500 744,611 616,482 Cash & equivalente Accorants receivable Imenores Prepaid expenses Other Total cattente Property, plant, & equipment Les depreciation Net property, plant, & cq=pment Interible acts Other Totalanta Bank loan Accounts payable Current portion of long-term debet Actuals and other Total current liabilities Deferred taxes Long-term debe Deferred pension conta Other liabilities Total Common stock, 51 par vale ( Capital in excess of p Camellative tralasin azijatment Retained caring Les travay bockatoo Total shareholders' equity Total liabilities & equity 23,585 $ 1,011,8763 $ 51,294 $ 54,674 450 194.051 300,479 25,479 13,500 67,185 263,033 306,187 3,149 2.273 26,532 26,954 963,333 5 1,082,024 107,018 5 112,472 51.359 56,291 225 2,273 242.480 401,051 445,556 20,654 24,789 13,163 45,082 96,488 105,240 8.16 11.258 539,520 631,874 28,253 161,851 161,834 30,312 40,485 219,098 235,313 15.735 05.735) 423,818 450,149 963,333 5 1,082,022 410,120 161,811 0,849) 437,247 05.735 601,757 $ 1,011,8763 Note: Praction is advindayo ni 0% 4. What happens to Rockboro's financing need and unused debt capacity if: a) No dividends are paid Disclosure The model we use to demonstrate each scenario in this item is based on adjusted model of provided projection of exhibits 26.8. In case Assumption 2015(F) 2016F) 20171F) 2018/F) 2019F) 2020/F) 2021F) Sales Grown 15.00% 15.00% 15.00% 15.00% 15.00% 15.00% 15.00% 94NPM 210% 4.00% 5.00% 550% 600% 6.50% 6.50% Dividends 0.00% 0.00% 0.00% 0.00% 0.00% 0.00% 0.00% (Projection Sales N N Sersity Test 1.305.0 274 0% 274 339 1.5008 600 0% 600 290 1.7259 86.3 0% 863 44.9 1.9647 1092 0% 1092 51.6 22825 1369 0% 1369 99.4 26248 1706 0% 1706 684 30185 1962 0% 1962 785 Adused Deprec CAPEX Change in C (65.3) (29.3) (750) (33.6 (863) (387) (99.3) (1027) (512) ( (1181) (58.8 (445) (1359 (67.7) ( (33.3) (9.6 62 17.0 424 621 711 - (333) (9.6 62 17.0 24 @1 7L1 Excess Cash (Cash Defit Dividends Net Cash (Funding neech Total IBD (ST+CPLTD-LT) Equity DE ratio Target DEratos 199,0 450.0 05. 40% 1686 5100 033 104 9963 145.4 706.5 azi 1080 8024 012 409 -302 10120 12092 004 Net Cash Exhibet 2 Rockboro Machine Tools Corporation Comodato Balance Shots Sa thosands of dollara) Projected 2015 $ 20,876 $ 312,812 345,513 21,389 33.276 733.865 491,405 251.121 240,284 33,345 $ 280,853 305,832 19,524 31.071 670,625 538,262 326,265 325,12 22,517 31,500 744,611 616,482 Cash & equivalente Accorants receivable Imenores Prepaid expenses Other Total cattente Property, plant, & equipment Les depreciation Net property, plant, & cq=pment Interible acts Other Totalanta Bank loan Accounts payable Current portion of long-term debet Actuals and other Total current liabilities Deferred taxes Long-term debe Deferred pension conta Other liabilities Total Common stock, 51 par vale ( Capital in excess of p Camellative tralasin azijatment Retained caring Les travay bockatoo Total shareholders' equity Total liabilities & equity 23,585 $ 1,011,8763 $ 51,294 $ 54,674 450 194.051 300,479 25,479 13,500 67,185 263,033 306,187 3,149 2.273 26,532 26,954 963,333 5 1,082,024 107,018 5 112,472 51.359 56,291 225 2,273 242.480 401,051 445,556 20,654 24,789 13,163 45,082 96,488 105,240 8.16 11.258 539,520 631,874 28,253 161,851 161,834 30,312 40,485 219,098 235,313 15.735 05.735) 423,818 450,149 963,333 5 1,082,022 410,120 161,811 0,849) 437,247 05.735 601,757 $ 1,011,8763 Note: Praction is advindayo ni 0% 4. What happens to Rockboro's financing need and unused debt capacity if: a) No dividends are paid Disclosure The model we use to demonstrate each scenario in this item is based on adjusted model of provided projection of exhibits 26.8. In case Assumption 2015(F) 2016F) 20171F) 2018/F) 2019F) 2020/F) 2021F) Sales Grown 15.00% 15.00% 15.00% 15.00% 15.00% 15.00% 15.00% 94NPM 210% 4.00% 5.00% 550% 600% 6.50% 6.50% Dividends 0.00% 0.00% 0.00% 0.00% 0.00% 0.00% 0.00% (Projection Sales N N Sersity Test 1.305.0 274 0% 274 339 1.5008 600 0% 600 290 1.7259 86.3 0% 863 44.9 1.9647 1092 0% 1092 51.6 22825 1369 0% 1369 99.4 26248 1706 0% 1706 684 30185 1962 0% 1962 785 Adused Deprec CAPEX Change in C (65.3) (29.3) (750) (33.6 (863) (387) (99.3) (1027) (512) ( (1181) (58.8 (445) (1359 (67.7) ( (33.3) (9.6 62 17.0 424 621 711 - (333) (9.6 62 17.0 24 @1 7L1 Excess Cash (Cash Defit Dividends Net Cash (Funding neech Total IBD (ST+CPLTD-LT) Equity DE ratio Target DEratos 199,0 450.0 05. 40% 1686 5100 033 104 9963 145.4 706.5 azi 1080 8024 012 409 -302 10120 12092 004 Net Cash


