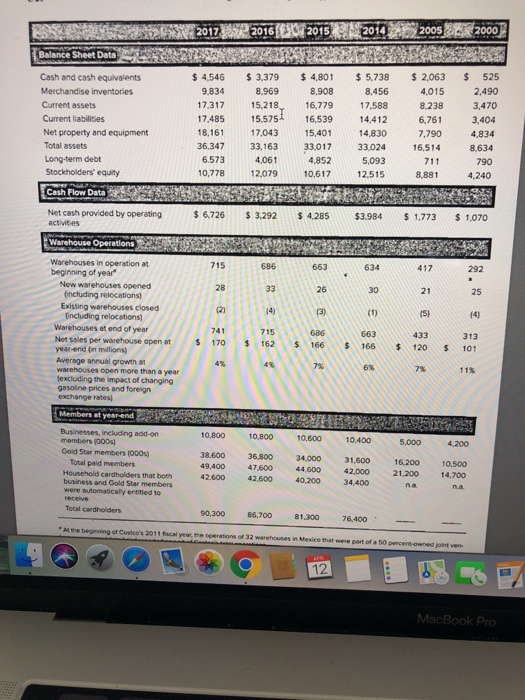
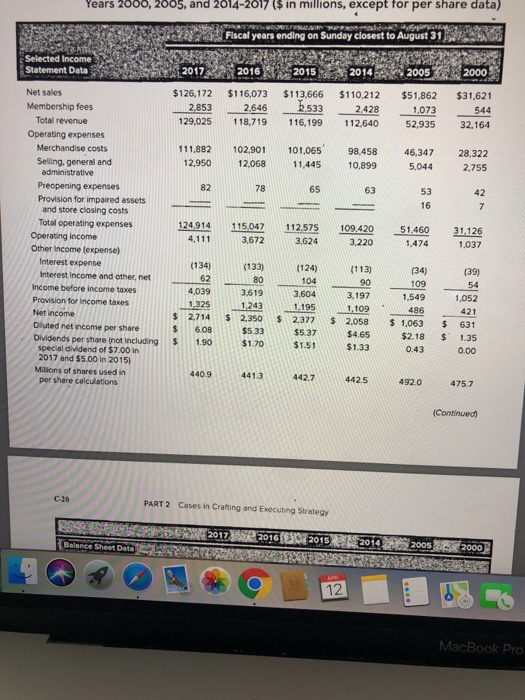
how do i find the debt to equity ratio and the cagr for 2017?
S S W 2017 2016 2015 2014 2005 2000 Balance Sheet Data Cash and cash equivalents Merchandise inventories Current assets Current liabilities Net property and equipment Total assets Long-term debt Stockholders' equity Cash Flow Data $ 4.546 9.834 17 317 17.485 18,161 36.347 6.573 10,778 $ 3.379 8,969 15,218 15,575 17,043 33,163 4,061 12.079 $ 4,801 8.908 16.779 16,539 15,401 33,017 4,852 10,617 $5,738 8,456 17,588 14,412 14,830 33,024 5,093 12.515 $ 2,063 4,015 8.238 6,761 7.790 16,514 711 8,881 $ 525 2,490 3,470 3.404 4,834 8,634 790 4,240 $ 6,726 $ 3.292 $ 4.285 $3.984 5 1,773 $ 1.070 Net cash provided by operating activities Warehouse Operations 634 663 26 30 Gais Warehouses in operation at 686 beginning of year New warehouses opened including relocations) Existing warehouses closed including relocations) Warehouses at end of year Net sales per warehouse open at $ $ 166 $ 166 $ 120 $ 101 year-end in millions) Average annual growth a warehouses open more than a year excluding the impact of changing gasoline prices and foreign exchange rates) Members at year-end ETTER Businesses, including add-on 10,800 10.800 10.500 10.400 5.000 4.200 members (0005) Gold Star members 1000s) 38.600 36,800 34,000 31,600 16,200 10,500 Total paid members 47,600 44,600 42.000 21,200 14.700 Household cardholders that both 42.600 42.600 40,200 34.400 business and Gold Star members were automatically entitled to receive Total Cardholders 90.300 86.700 81.300 76 400- 49.400 *Mthe beginning of Costco's 2011 fcal year, persions of 32 warehouses in Mexico that were part of a 50 percent ownedj e MacBook Pro Years 2000, 2005, and 2014-2017 ($ in millions, except for per share data) TENANT Fiscal years ending on Sunday closest to August 31 SERRAT Selected Income Statement Data 2017 2014 2005 2000 $126,172 2.853 129,025 $116,073 2,646 118,719 2015 $113,666 5.533 116,199 $110,212 2.428 112,640 $51,862 1,073 52,935 $31,621 544 32.164 111.882 12,950 102,901 12,068 101,065 11,445 98.458 10.899 46,347 5,044 28,322 2.755 78 65 42 53 16 124.914 4,111 115.047 Net sales Membership fees Total revenue Operating expenses Merchandise costs Selling general and administrative Preopening expenses Provision for impaired assets and store closing costs Total operating expenses Operating income Other Income (expense) Interest expense Interest Income and other, net Income before income taxes Provision for income taxes Net income Diluted net income per share Dividends per share (not including special dividend of $7.00 in 2017 and $5.00 in 2015) Millions of shares used in per share calculations 112.575 3.624 51.460 3,672 109.420 3220 31.126 1,037 474 (134) (133) (124) (34) (39) 109 54 3.604 4,039 1,325 2,714 6,08 1.90 3.619 1.243 2.350 $5 33 $1.70 $ $ $ (113) 90 3.197 1.109 2.058 $4.65 $1.33 $ 1.195 2,377 $5.37 $1.51 1.549 486 $ 1.063 $2.18 0.43 1,052 421 631 1.35 0.00 $ 441.3 442.7 442.5 492.0 475.7 (Continued PART 2 Cases in Crafting and executing Strategy 2017 Balance Sheet Dato 2016 RESIDE 2015 RABA 2010 BS 2005 R MacBook Pro S S W 2017 2016 2015 2014 2005 2000 Balance Sheet Data Cash and cash equivalents Merchandise inventories Current assets Current liabilities Net property and equipment Total assets Long-term debt Stockholders' equity Cash Flow Data $ 4.546 9.834 17 317 17.485 18,161 36.347 6.573 10,778 $ 3.379 8,969 15,218 15,575 17,043 33,163 4,061 12.079 $ 4,801 8.908 16.779 16,539 15,401 33,017 4,852 10,617 $5,738 8,456 17,588 14,412 14,830 33,024 5,093 12.515 $ 2,063 4,015 8.238 6,761 7.790 16,514 711 8,881 $ 525 2,490 3,470 3.404 4,834 8,634 790 4,240 $ 6,726 $ 3.292 $ 4.285 $3.984 5 1,773 $ 1.070 Net cash provided by operating activities Warehouse Operations 634 663 26 30 Gais Warehouses in operation at 686 beginning of year New warehouses opened including relocations) Existing warehouses closed including relocations) Warehouses at end of year Net sales per warehouse open at $ $ 166 $ 166 $ 120 $ 101 year-end in millions) Average annual growth a warehouses open more than a year excluding the impact of changing gasoline prices and foreign exchange rates) Members at year-end ETTER Businesses, including add-on 10,800 10.800 10.500 10.400 5.000 4.200 members (0005) Gold Star members 1000s) 38.600 36,800 34,000 31,600 16,200 10,500 Total paid members 47,600 44,600 42.000 21,200 14.700 Household cardholders that both 42.600 42.600 40,200 34.400 business and Gold Star members were automatically entitled to receive Total Cardholders 90.300 86.700 81.300 76 400- 49.400 *Mthe beginning of Costco's 2011 fcal year, persions of 32 warehouses in Mexico that were part of a 50 percent ownedj e MacBook Pro Years 2000, 2005, and 2014-2017 ($ in millions, except for per share data) TENANT Fiscal years ending on Sunday closest to August 31 SERRAT Selected Income Statement Data 2017 2014 2005 2000 $126,172 2.853 129,025 $116,073 2,646 118,719 2015 $113,666 5.533 116,199 $110,212 2.428 112,640 $51,862 1,073 52,935 $31,621 544 32.164 111.882 12,950 102,901 12,068 101,065 11,445 98.458 10.899 46,347 5,044 28,322 2.755 78 65 42 53 16 124.914 4,111 115.047 Net sales Membership fees Total revenue Operating expenses Merchandise costs Selling general and administrative Preopening expenses Provision for impaired assets and store closing costs Total operating expenses Operating income Other Income (expense) Interest expense Interest Income and other, net Income before income taxes Provision for income taxes Net income Diluted net income per share Dividends per share (not including special dividend of $7.00 in 2017 and $5.00 in 2015) Millions of shares used in per share calculations 112.575 3.624 51.460 3,672 109.420 3220 31.126 1,037 474 (134) (133) (124) (34) (39) 109 54 3.604 4,039 1,325 2,714 6,08 1.90 3.619 1.243 2.350 $5 33 $1.70 $ $ $ (113) 90 3.197 1.109 2.058 $4.65 $1.33 $ 1.195 2,377 $5.37 $1.51 1.549 486 $ 1.063 $2.18 0.43 1,052 421 631 1.35 0.00 $ 441.3 442.7 442.5 492.0 475.7 (Continued PART 2 Cases in Crafting and executing Strategy 2017 Balance Sheet Dato 2016 RESIDE 2015 RABA 2010 BS 2005 R MacBook Pro


