

Question: How do I get the answers for the chart Summary? Alt 2 through Alt 5 How do I get answer for question 1? Alter. (annual

How do I get the answers for the chart Summary? Alt 2 through Alt 5
How do I get answer for question 1?
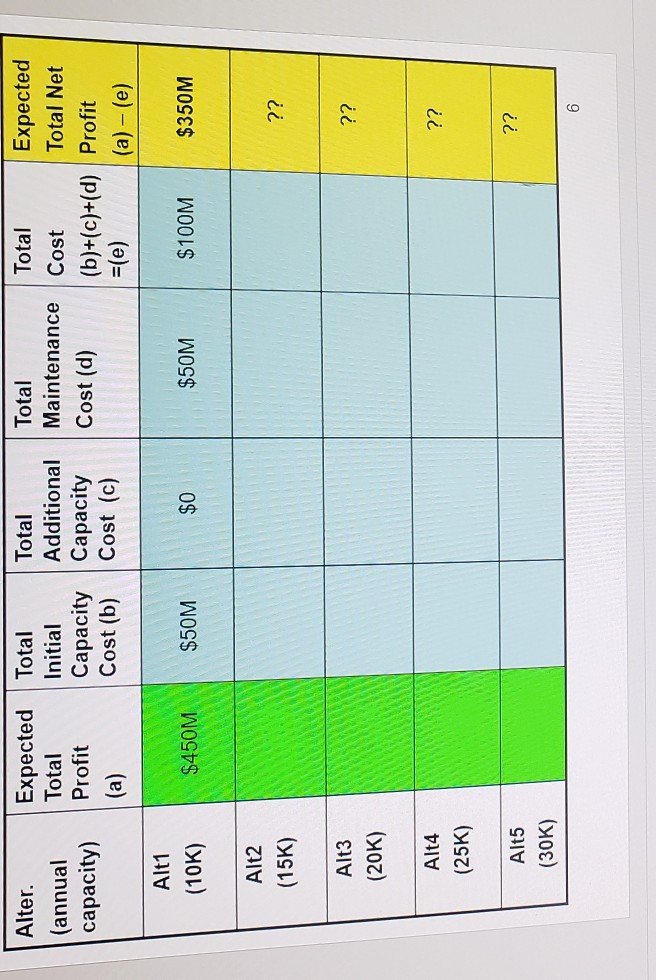
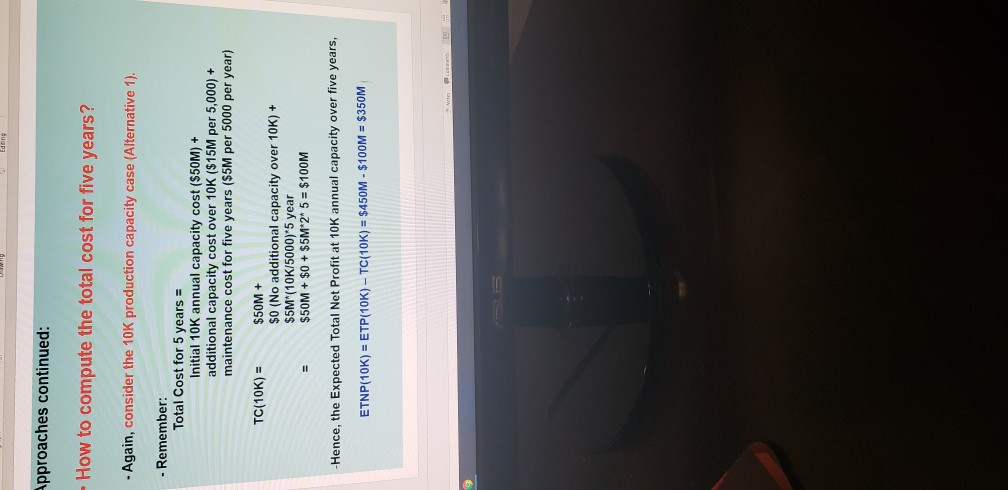
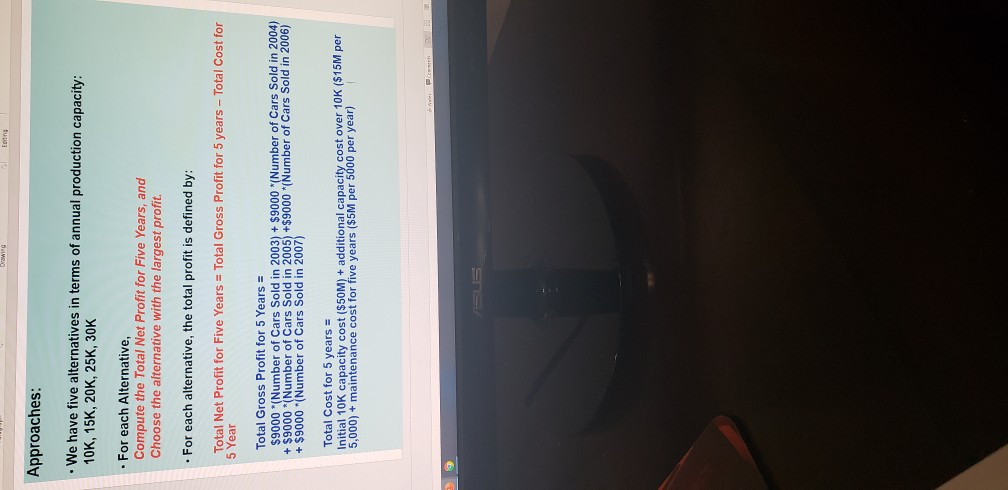
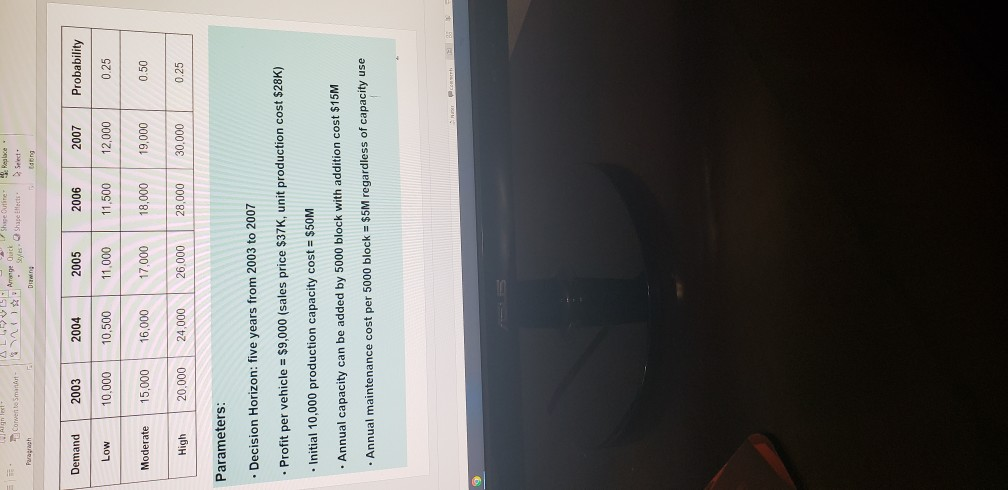
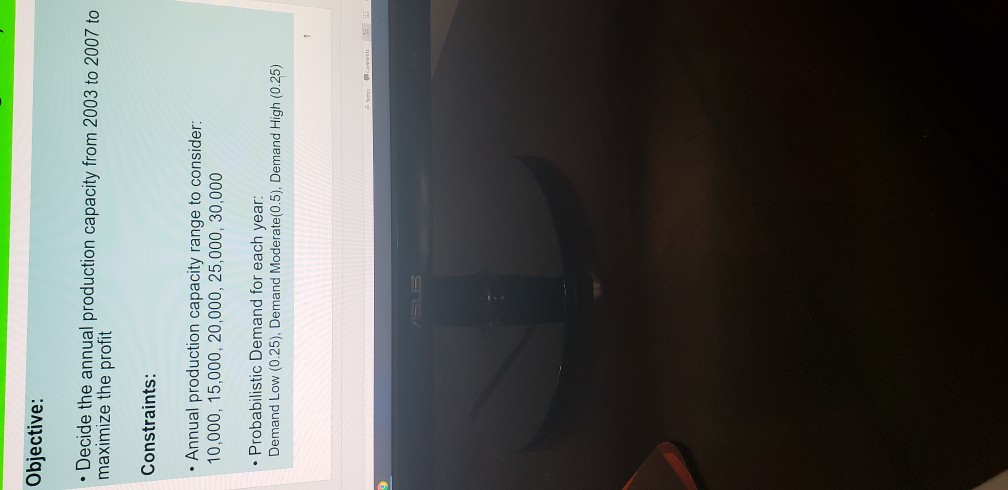
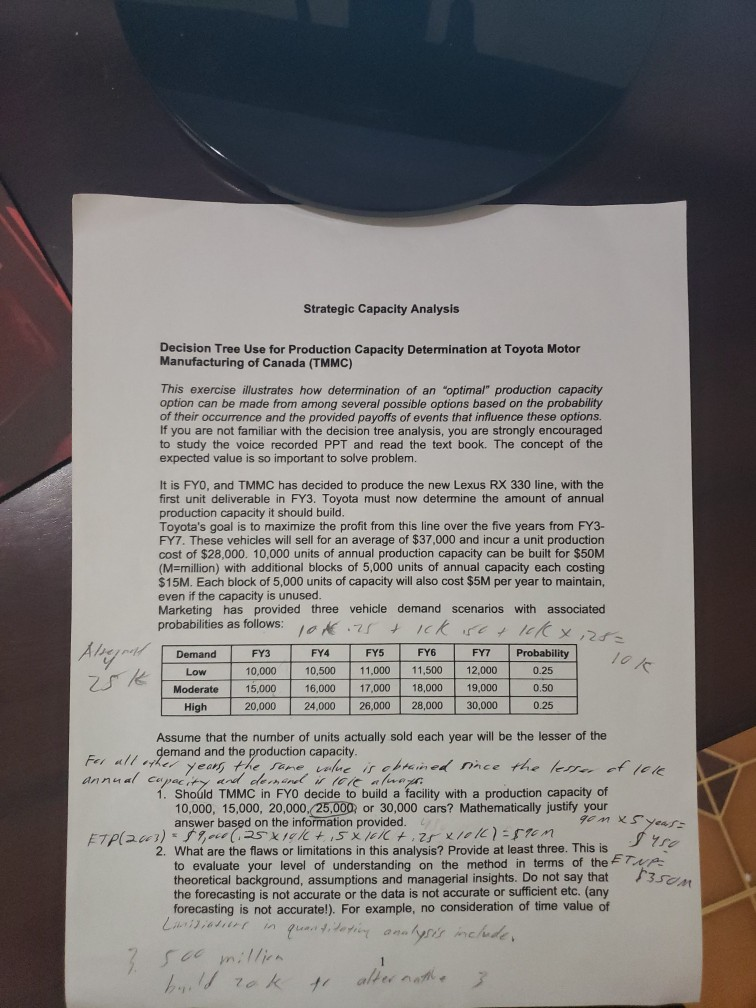
Alter. (annual capacity) Expected Total Total Initial Profit Capacity (a) Cost (b) Total Additional Capacity Cost (c) Total Maintenance Cost (d) Total Expected Cost Total Net (b)+(c)+(d) Profit =(e) (a) -(e) Alt1 (10K) $450M $50M $0 $50M $100M $350M Alt2 (15K) ?? ?? Alt3 (20K) ?? Alt4 (25K) ?? Alt5 (30K) 6 Approaches continued: - How to compute the total cost for five years? - Again, consider the 10K production capacity case (Alternative 1). - Remember: Total Cost for 5 years = Initial 10K annual capacity cost ($50M) + additional capacity cost over 10K ($15M per 5,000) + maintenance cost for five years ($5M per 5000 per year) TC(10K) = $50M + $0 (No additional capacity over 10K) + $5M*(10K/5000)*5 year $50M + $0 + $5M*2* 5 = $100M -Hence, the Expected Total Net Profit at 10K annual capacity over five years, ETNP(10K) = ETP(10K) - TC(10K) = $450M - $100M = $350M SOOD P Find Il Text Orechon NinTest ALLE Convert to SmartWage Dick Styles Shelfedis - Paroh Duwing Select Editing Approaches continued: How to decide Number of Cars sold at each year? - This depends on the annual capacity and the probabilistic forecasting for each year. How? the number of cars sold in 2003 = lesser of production capacity (10K) and probabilistic demand! - i.e. Consider 10K annual production capacity. The demand of 2003 has three possibilities: 10K with 0.25, 15K with 0.5, 20K with 0.25. - With 0.25 (Low), the number of cars sold in 2003 = lesser of 10K and 10K = 10K With 0.50,(Moderate), the number of cars sold in 2003 = lesser of 10K and 15K = 10K, - With 0.25 (High), the number of cars sold in 2003 = lesser of 10K and 20K = 10K How to compute the Expected Total Gross Profit at 10K production capacity for five years? Let ETP(10K) = ETP(2003) + ETP(2004) + ETP(2005) + ETP(2006) + ETP(2007) ETP(2003) = $9,000 (0.25*10K + 0.5 10K + 0.25 10K) = $90M. Note that for all other years, the same value is obtained since the lesser of 10K annual capacity and demand is 10K always. Hence. ETP(10K) = $90M * 5 = $450M 9 Approaches: . We have five alternatives in terms of annual production capacity: 10K, 15K, 20K, 25K, 30K . For each Alternative, Compute the Total Net Profit for Five Years, and Choose the alternative with the largest profit. . For each alternative, the total profit is defined by: Total Net Profit for Five Years = Total Gross Profit for 5 years - Total Cost for 5 Year Total Gross Profit for 5 Years = $9000 "(Number of Cars Sold in 2003) + $9000 (Number of Cars Sold in 2004) + $9000 Number of Cars Sold in 2005) +$9000 (Number of Cars Sold in 2006) + $9000 "I Number of Cars Sold in 2007) Total Cost for 5 years = Initial 10K capacity cost ($50M) + additional capacity cost over 10K ($15M per 5,000) + maintenance cost for five years ($5M per 5000 per year) Aceh AL4VV 1 Corwento Smart Page Arrange Quick Shape Outine Replace styles. Shape Elect & select- Drawing Long Demand 2003 2004 2005 2006 2007 Probability Low 10.000 10,500 11.000 11,500 12,000 0.25 Moderate 15,000 16,000 17,000 18,000 19,000 0.50 High 20.000 24,000 26.000 28,000 30,000 0.25 Parameters: . Decision Horizon: five years from 2003 to 2007 Profit per vehicle = $9,000 (sales price $37K, unit production cost $28K) Initial 10,000 production capacity cost = $50M Annual capacity can be added by 5000 block with addition cost $15M Annual maintenance cost per 5000 block = $5M regardless of capacity use ch Strategic Capacity Analysis Decision Tree Use for Production Capacity Determination at Toyota Motor Manufacturing of Canada (TMMC) This exercise illustrates how determination of an "optimal" production capacity option can be made from among several possible options based on the probability of their occurrence and the provided payoffs of events that influence these options. If you are not familiar with the decision tree analysis, you are strongly encouraged to study the voice recorded PPT and read the text book. The concept of the expected value is so important to solve problem. It is FYO, and TMMC has decided to produce the new Lexus RX 330 line, with the first unit deliverable in FY3. Toyota must now determine the amount of annual production capacity it should build. Toyota's goal is to maximize the profit from this line over the five years from FY3- FY7. These vehicles will sell for an average of $37,000 and incur a unit production cost of $28,000. 10,000 units of annual production capacity can be built for $50M (M=million) with additional blocks of 5,000 units of annual capacity each costing $15M. Each block of 5,000 units of capacity will also cost $5M per year to maintain, even if the capacity is unused. Marketing has provided three vehicle demand scenarios with associated probabilities as follows: ick ist & lok 8,25= Demand FY3 FY4 FY5 FY6 FY7 Probability Low 10.000 10,500 11.000 11,500 12,000 0.25 Moderate 15,000 16,000 17,000 18,000 19,000 0.50 High 20,000 24.000 26,000 28,000 30,000 0.25 | Aleynal qon x5 years $450 Assume that the number of units actually sold each year will be the lesser of the demand and the production capacity. For all other years, the same, inlue is obtained since the lesser of 1066 annual capacity and demand fold always 1. Should TMMC in FYO decide to build a facility with a production capacity of 10,000, 15,000, 20,000,25,000 or 30,000 cars? Mathematically justify your answer based on the information provided. Et on Creme 2. What are the flaws or limitations this analysis? Provide at least three. This is to evaluate your level of understanding on the method in terms of the ETNA theoretical background, assumptions and managerial insights. Do not say that the forecasting is not accurate or the data is not accurate or sufficient etc. (any forecasting is not accurate!). For example, no consideration of time value of Liviilisters in quantitating analysis include. 3. 500 million build rok 3som Alter. (annual capacity) Expected Total Total Initial Profit Capacity (a) Cost (b) Total Additional Capacity Cost (c) Total Maintenance Cost (d) Total Expected Cost Total Net (b)+(c)+(d) Profit =(e) (a) -(e) Alt1 (10K) $450M $50M $0 $50M $100M $350M Alt2 (15K) ?? ?? Alt3 (20K) ?? Alt4 (25K) ?? Alt5 (30K) 6 Approaches continued: - How to compute the total cost for five years? - Again, consider the 10K production capacity case (Alternative 1). - Remember: Total Cost for 5 years = Initial 10K annual capacity cost ($50M) + additional capacity cost over 10K ($15M per 5,000) + maintenance cost for five years ($5M per 5000 per year) TC(10K) = $50M + $0 (No additional capacity over 10K) + $5M*(10K/5000)*5 year $50M + $0 + $5M*2* 5 = $100M -Hence, the Expected Total Net Profit at 10K annual capacity over five years, ETNP(10K) = ETP(10K) - TC(10K) = $450M - $100M = $350M SOOD P Find Il Text Orechon NinTest ALLE Convert to SmartWage Dick Styles Shelfedis - Paroh Duwing Select Editing Approaches continued: How to decide Number of Cars sold at each year? - This depends on the annual capacity and the probabilistic forecasting for each year. How? the number of cars sold in 2003 = lesser of production capacity (10K) and probabilistic demand! - i.e. Consider 10K annual production capacity. The demand of 2003 has three possibilities: 10K with 0.25, 15K with 0.5, 20K with 0.25. - With 0.25 (Low), the number of cars sold in 2003 = lesser of 10K and 10K = 10K With 0.50,(Moderate), the number of cars sold in 2003 = lesser of 10K and 15K = 10K, - With 0.25 (High), the number of cars sold in 2003 = lesser of 10K and 20K = 10K How to compute the Expected Total Gross Profit at 10K production capacity for five years? Let ETP(10K) = ETP(2003) + ETP(2004) + ETP(2005) + ETP(2006) + ETP(2007) ETP(2003) = $9,000 (0.25*10K + 0.5 10K + 0.25 10K) = $90M. Note that for all other years, the same value is obtained since the lesser of 10K annual capacity and demand is 10K always. Hence. ETP(10K) = $90M * 5 = $450M 9 Approaches: . We have five alternatives in terms of annual production capacity: 10K, 15K, 20K, 25K, 30K . For each Alternative, Compute the Total Net Profit for Five Years, and Choose the alternative with the largest profit. . For each alternative, the total profit is defined by: Total Net Profit for Five Years = Total Gross Profit for 5 years - Total Cost for 5 Year Total Gross Profit for 5 Years = $9000 "(Number of Cars Sold in 2003) + $9000 (Number of Cars Sold in 2004) + $9000 Number of Cars Sold in 2005) +$9000 (Number of Cars Sold in 2006) + $9000 "I Number of Cars Sold in 2007) Total Cost for 5 years = Initial 10K capacity cost ($50M) + additional capacity cost over 10K ($15M per 5,000) + maintenance cost for five years ($5M per 5000 per year) Aceh AL4VV 1 Corwento Smart Page Arrange Quick Shape Outine Replace styles. Shape Elect & select- Drawing Long Demand 2003 2004 2005 2006 2007 Probability Low 10.000 10,500 11.000 11,500 12,000 0.25 Moderate 15,000 16,000 17,000 18,000 19,000 0.50 High 20.000 24,000 26.000 28,000 30,000 0.25 Parameters: . Decision Horizon: five years from 2003 to 2007 Profit per vehicle = $9,000 (sales price $37K, unit production cost $28K) Initial 10,000 production capacity cost = $50M Annual capacity can be added by 5000 block with addition cost $15M Annual maintenance cost per 5000 block = $5M regardless of capacity use ch Strategic Capacity Analysis Decision Tree Use for Production Capacity Determination at Toyota Motor Manufacturing of Canada (TMMC) This exercise illustrates how determination of an "optimal" production capacity option can be made from among several possible options based on the probability of their occurrence and the provided payoffs of events that influence these options. If you are not familiar with the decision tree analysis, you are strongly encouraged to study the voice recorded PPT and read the text book. The concept of the expected value is so important to solve problem. It is FYO, and TMMC has decided to produce the new Lexus RX 330 line, with the first unit deliverable in FY3. Toyota must now determine the amount of annual production capacity it should build. Toyota's goal is to maximize the profit from this line over the five years from FY3- FY7. These vehicles will sell for an average of $37,000 and incur a unit production cost of $28,000. 10,000 units of annual production capacity can be built for $50M (M=million) with additional blocks of 5,000 units of annual capacity each costing $15M. Each block of 5,000 units of capacity will also cost $5M per year to maintain, even if the capacity is unused. Marketing has provided three vehicle demand scenarios with associated probabilities as follows: ick ist & lok 8,25= Demand FY3 FY4 FY5 FY6 FY7 Probability Low 10.000 10,500 11.000 11,500 12,000 0.25 Moderate 15,000 16,000 17,000 18,000 19,000 0.50 High 20,000 24.000 26,000 28,000 30,000 0.25 | Aleynal qon x5 years $450 Assume that the number of units actually sold each year will be the lesser of the demand and the production capacity. For all other years, the same, inlue is obtained since the lesser of 1066 annual capacity and demand fold always 1. Should TMMC in FYO decide to build a facility with a production capacity of 10,000, 15,000, 20,000,25,000 or 30,000 cars? Mathematically justify your answer based on the information provided. Et on Creme 2. What are the flaws or limitations this analysis? Provide at least three. This is to evaluate your level of understanding on the method in terms of the ETNA theoretical background, assumptions and managerial insights. Do not say that the forecasting is not accurate or the data is not accurate or sufficient etc. (any forecasting is not accurate!). For example, no consideration of time value of Liviilisters in quantitating analysis include. 3. 500 million build rok 3somStep by Step Solution
There are 3 Steps involved in it
1 Expert Approved Answer
Step: 1 Unlock

Question Has Been Solved by an Expert!
Get step-by-step solutions from verified subject matter experts
Step: 2 Unlock
Step: 3 Unlock