Answered step by step
Verified Expert Solution
Link Copied!

Question

1 Approved Answer

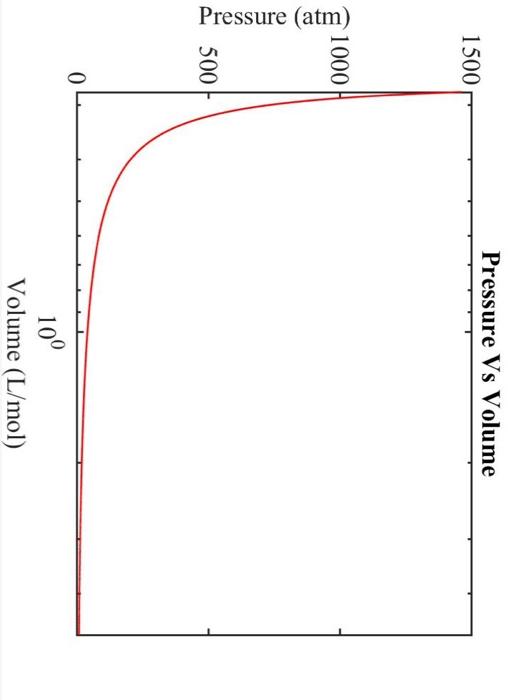
how do i get the graph to look like this? Real Gasses Ammonia vapor is compressed to 60 bar and 105C. Use the SRK equation

how do i get the graph to look like this? image text in transcribed
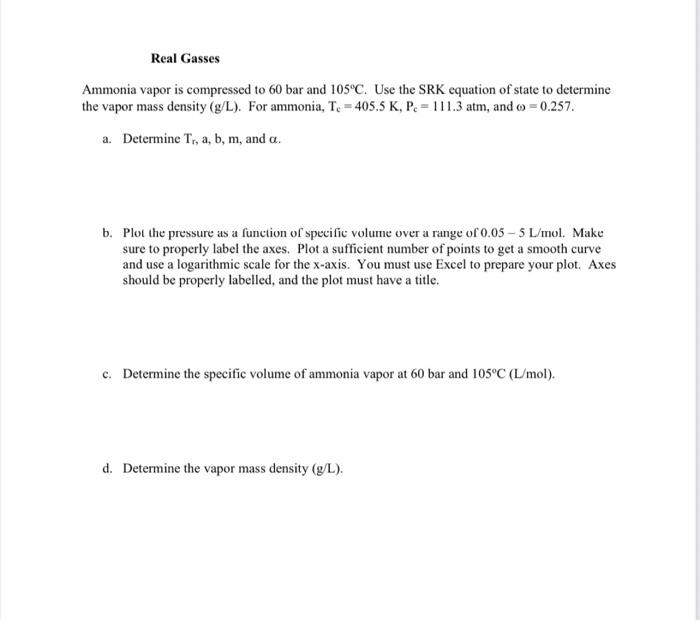
image text in transcribed
Real Gasses Ammonia vapor is compressed to 60 bar and 105C. Use the SRK equation of state to determine the vapor mass density (g/L). For ammonia, Tc=405.5K,Pc=111.3atm, and =0.257. a. Determine Tr,a,b,m, and . b. Plot the pressure as a function of specific volume over a range of 0.055L/mol. Make sure to properly label the axes. Plot a sufficient number of points to get a smooth curve and use a logarithmic scale for the x-axis. You must use Excel to prepare your plot. Axes should be properly labelled, and the plot must have a title. c. Determine the specific volume of ammonia vapor at 60 bar and 105C(L/mol). d. Determine the vapor mass density (g/L)

Step by Step Solution

There are 3 Steps involved in it

Step: 1

blur-text-image

Get Instant Access to Expert-Tailored Solutions

See step-by-step solutions with expert insights and AI powered tools for academic success

Step: 2

blur-text-image

Step: 3

blur-text-image

Ace Your Homework with AI

Get the answers you need in no time with our AI-driven, step-by-step assistance

Get Started

Recommended Textbook for

Introduction To Chemical Engineering Tools For Today And Tomorrow

Authors: Kenneth A. Solen, John N. Harb

5th Edition

0470885726, 978-0470885727

More Books

Students also viewed these Chemical Engineering questions

Question

How much overlap should be provided between APs? Why?

Answered: 1 week ago