How do I solve these in Excel
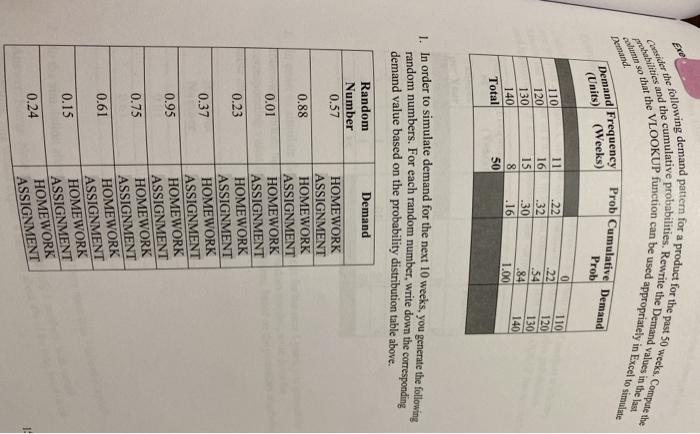
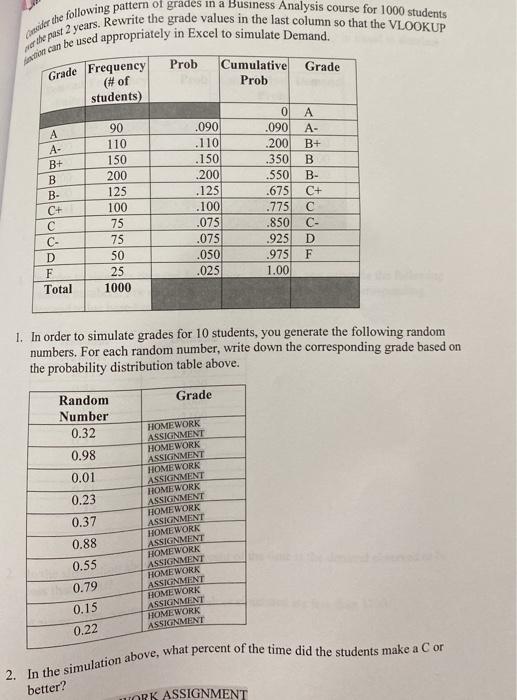
Csider the following demand pattern for a product for the past 50 wecks, Compute the Wilities and the cumulative probabilities. Rewrite the Demand values in the last so that the VLOOKUP function can be used appropriately in Excel to simulate AwAR. Demand Frequency (Units) (Weeks) Prob Cumulative Demand Prob 110 22 110 120 11 16 15 8 50 0 .22 .54 84 1.00 .32 -30 .16 130 140 Total 120 130 140 1. In order to simulate demand for the next 10 weeks, you generate the following random numbers. For each random number, write down the corresponding demand value based on the probability distribution table above. Demand Random Number 0.57 0.88 0.01 0.23 HOMEWORK ASSIGNMENT HOMEWORK ASSIGNMENT HOMEWORK ASSIGNMENT HOMEWORK ASSIGNMENT HOMEWORK ASSIGNMENT HOMEWORK ASSIGNMENT HOMEWORK ASSIGNMENT 0.37 0.95 0.75 0.61 0.15 HOMEWORK ASSIGNMENT HOMEWORK ASSIGNMENT HOMEWORK ASSIGNMENT 0.24 1! er the following pattern of grades in a Business Analysis course for 1000 students merike past 2 years. Rewrite the grade values in the last column so that the VLOOKUP an be used appropriately in Excel to simulate Demand. Prob Cumulative Grade Prob Grade Frequency (# of students) A- B+ B B- C+ 90 110 150 200 125 100 75 75 50 25 1000 .090 .110 .150 .200 .125 .100 .075 .075 .050 .025 0 .090 .200 .350 .550 .675 .775 .850 .925 .975 1.00 A A- B+ B B- C+ C- D F olsa C- D F Total 1. In order to simulate grades for 10 students, you generate the following random numbers. For each random number, write down the corresponding grade based on the probability distribution table above. Grade Random Number 0.32 0.98 0.01 0.23 0.37 HOMEWORK ASSIGNMENT HOMEWORK ASSIGNMENT HOMEWORK ASSIGNMENT HOMEWORK ASSIGNMENT HOMEWORK ASSIGNMENT HOMEWORK ASSIGNMENT HOMEWORK ASSIGNMENT HOMEWORK ASSIGNMENT HOMEWORK ASSIGNMENT HOMEWORK ASSIGNMENT 0.88 0.55 0.79 0.15 0.22 2. In the simulation above, what percent of the time did the students make a C or better? MORK ASSIGNMENT Csider the following demand pattern for a product for the past 50 wecks, Compute the Wilities and the cumulative probabilities. Rewrite the Demand values in the last so that the VLOOKUP function can be used appropriately in Excel to simulate AwAR. Demand Frequency (Units) (Weeks) Prob Cumulative Demand Prob 110 22 110 120 11 16 15 8 50 0 .22 .54 84 1.00 .32 -30 .16 130 140 Total 120 130 140 1. In order to simulate demand for the next 10 weeks, you generate the following random numbers. For each random number, write down the corresponding demand value based on the probability distribution table above. Demand Random Number 0.57 0.88 0.01 0.23 HOMEWORK ASSIGNMENT HOMEWORK ASSIGNMENT HOMEWORK ASSIGNMENT HOMEWORK ASSIGNMENT HOMEWORK ASSIGNMENT HOMEWORK ASSIGNMENT HOMEWORK ASSIGNMENT 0.37 0.95 0.75 0.61 0.15 HOMEWORK ASSIGNMENT HOMEWORK ASSIGNMENT HOMEWORK ASSIGNMENT 0.24 1! er the following pattern of grades in a Business Analysis course for 1000 students merike past 2 years. Rewrite the grade values in the last column so that the VLOOKUP an be used appropriately in Excel to simulate Demand. Prob Cumulative Grade Prob Grade Frequency (# of students) A- B+ B B- C+ 90 110 150 200 125 100 75 75 50 25 1000 .090 .110 .150 .200 .125 .100 .075 .075 .050 .025 0 .090 .200 .350 .550 .675 .775 .850 .925 .975 1.00 A A- B+ B B- C+ C- D F olsa C- D F Total 1. In order to simulate grades for 10 students, you generate the following random numbers. For each random number, write down the corresponding grade based on the probability distribution table above. Grade Random Number 0.32 0.98 0.01 0.23 0.37 HOMEWORK ASSIGNMENT HOMEWORK ASSIGNMENT HOMEWORK ASSIGNMENT HOMEWORK ASSIGNMENT HOMEWORK ASSIGNMENT HOMEWORK ASSIGNMENT HOMEWORK ASSIGNMENT HOMEWORK ASSIGNMENT HOMEWORK ASSIGNMENT HOMEWORK ASSIGNMENT 0.88 0.55 0.79 0.15 0.22 2. In the simulation above, what percent of the time did the students make a C or better? MORK ASSIGNMENT