How do outliers effect PC scores? Perform a PCA (Principal Component Analysis) on the board stiffness dataset with and without detected outliers.
Answer using the R statistical computing platform
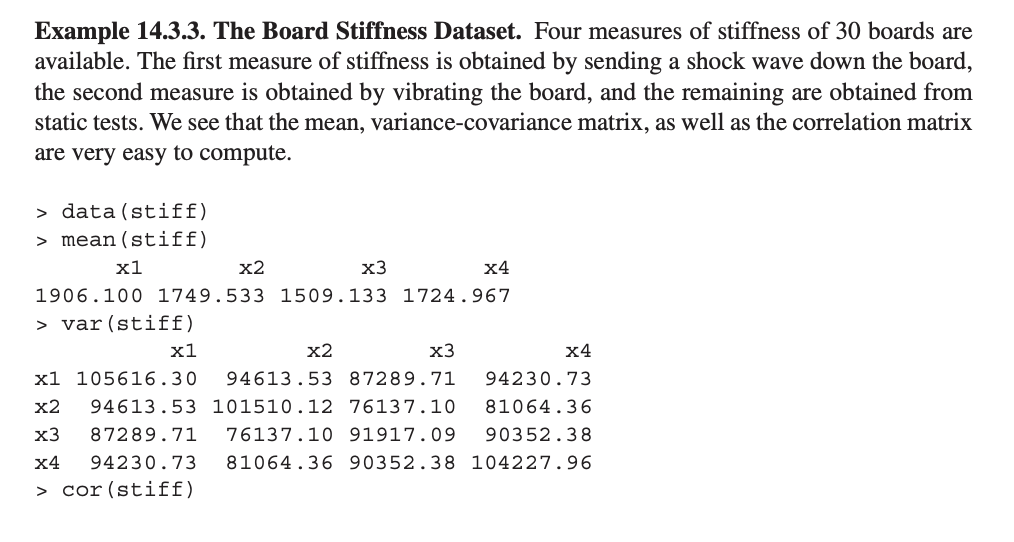
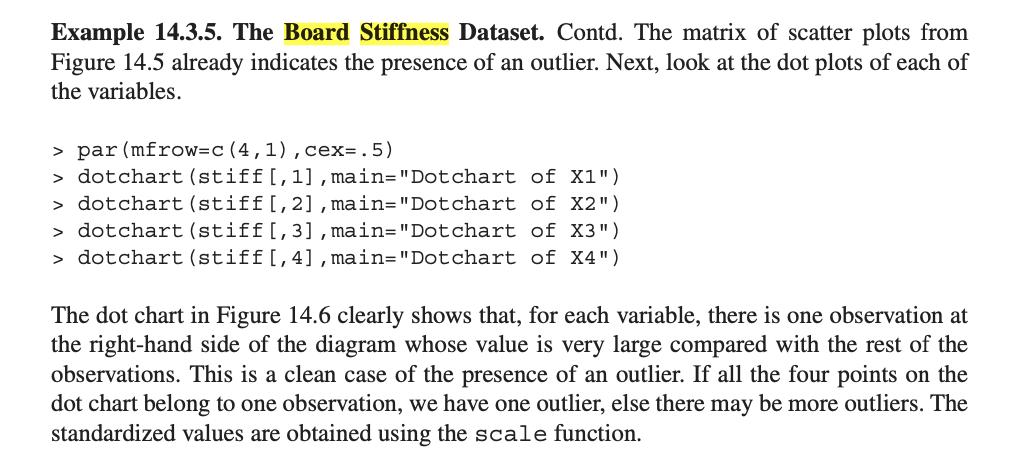
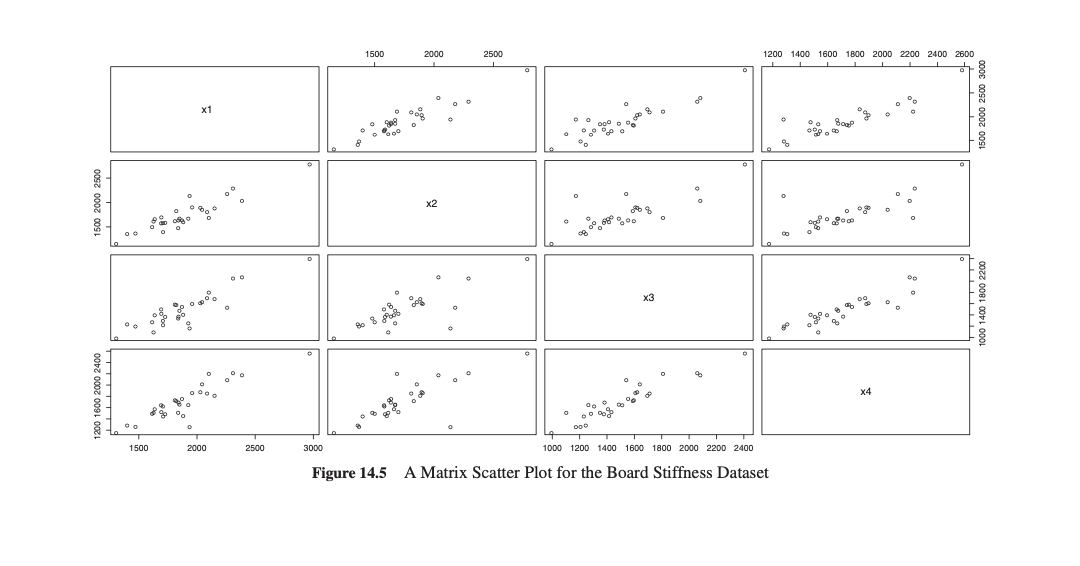
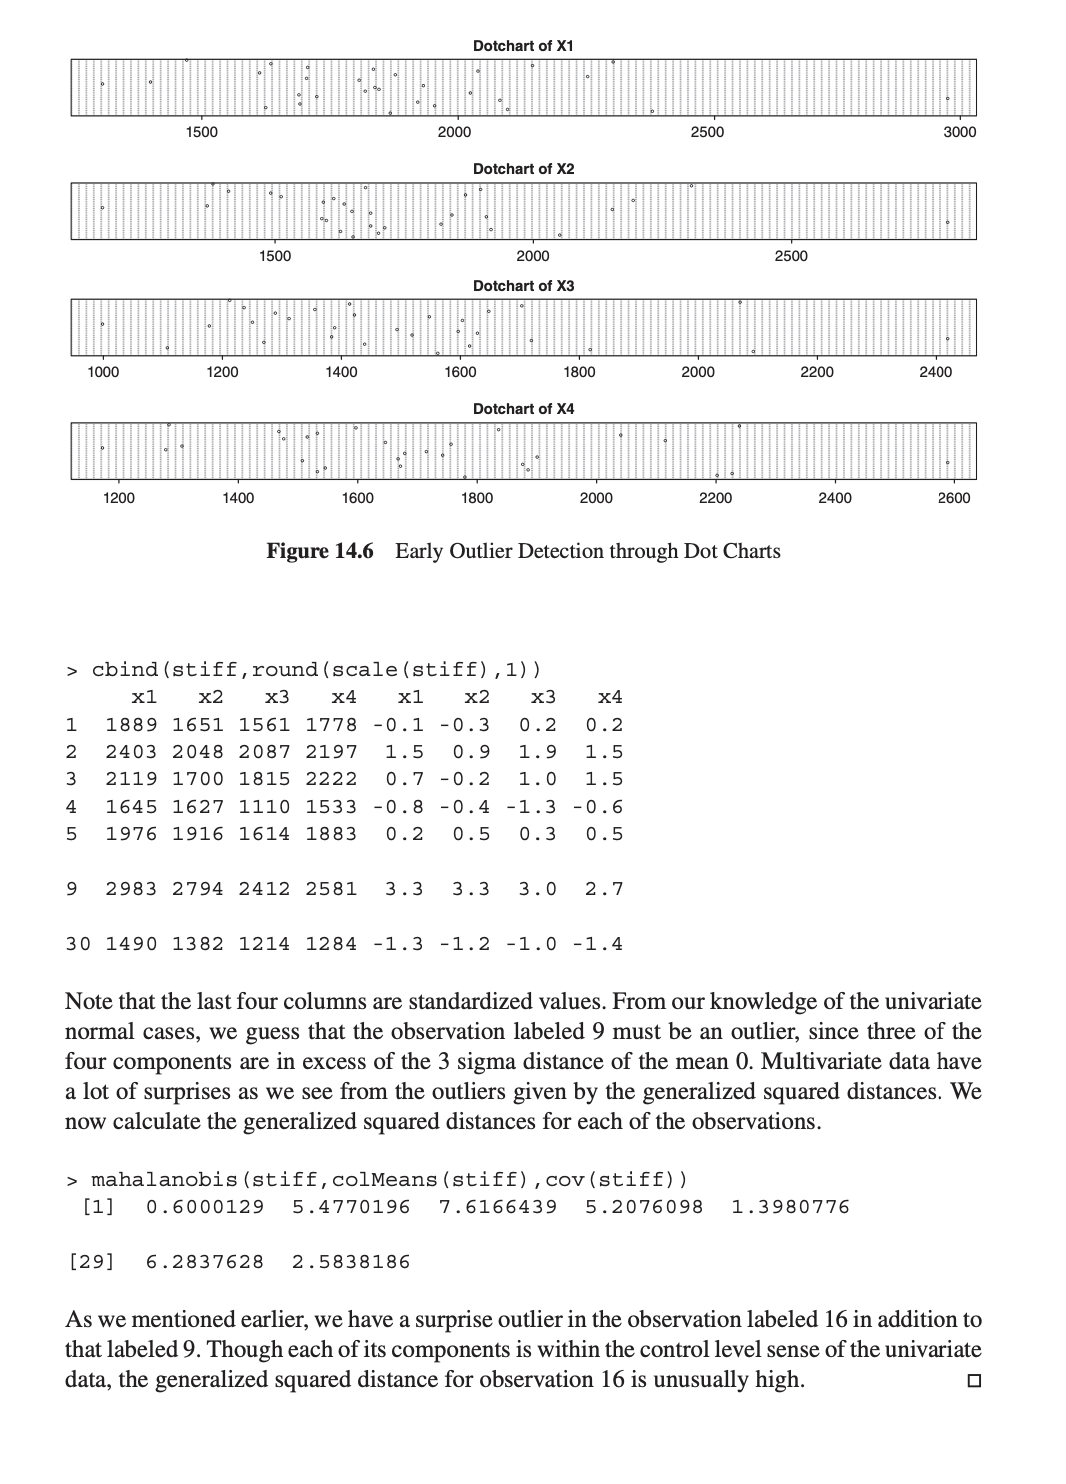
Example 14.3.3. The Board Stiffness Dataset. Four measures of stiffness of 30 boards are available. The rst measure of stiffness is obtained by sending a shock wave down the board, the second measure is obtained by vibrating the board, and the remaining are obtained from static tests. We see that the mean, variance-covariance matrix, as well as the correlation matrix are very easy to compute. > data(stiff} > mean(stiff} x1 x2 x3 x4 1906.100 1749.533 1509.133 1724.967 > var(stiff) x1 x2 x3 x4 x1 105616.30 94613.53 87289.71 94230.73 x2 94613.53 101510.12 76137.10 81064.36 x3 87289.71 76137.10 91917.09 90352.38 x4 94230.73 81064.36 90352.38 104227.96 > cor(stiff) x1 x2 x3 x4 x1 1.0000000 0.9137620 0.8859301 0.8981212 x2 0.9137620 1.0000000 0.7882129 0.7881034 x3 0.8859301 0.7882129 1.0000000 0.9231013 x4 0.8981212 0.7881034 0.9231013 1.0000000 > pairs(stiff} The matrix of scatter plots indicate that there might be an outlier among the observations. We will say more about this in the coming subsection. I:I Example 14.3.5. The Board Stiffness Dataset. Contd. The matrix of scatter plots from Figure 14.5 already indicates the presence of an outlier. Next, look at the dot plots of each of the variables. > par (mfrow=c (4, 1) , cex=. 5) > dotchart (stiff [, 1] , main="Dotchart of X1") > dotchart (stiff [, 2] , main= "Dotchart of X2") > dotchart (stiff [, 3] , main="Dotchart of X3") > dotchart (stiff [, 4] , main="Dotchart of X4") The dot chart in Figure 14.6 clearly shows that, for each variable, there is one observation at the right-hand side of the diagram whose value is very large compared with the rest of the observations. This is a clean case of the presence of an outlier. If all the four points on the dot chart belong to one observation, we have one outlier, else there may be more outliers. The standardized values are obtained using the scale function.\fDomhart of X1 1500 2000 2500 3000 Domhart of X2 1500 2000 2500 Butcher! of X3 1000 1200 1400 1600 1300 2000 2200 2400 Domhart of X4 1200 1400 1600 1300 2000 2200 2400 2600 Figure 14.6 Early Outlier Detection through Dot Charts 3 chindlstiff,round(scale (stiff) , 1) ) x1 x2 x3 x4 x1 x2 x3 x4 1 1339 1651 1561 1773 -0.1 -0.3 0.2 0.2 2 2403 2043 2037 2197 1.5 0.9 1.9 1.5 3 2119 1700 1315 2222 0.7 -0.2 1.0 1.5 4 1645 1627 1110 1533 -0.3 -0.4 -1.3 -0.6 5 1976 1916 1614 1333 0.2 0.5 0.3 0.5 9 2933 2794 2412 2531 3.3 3.3 3.0 2.7 30 1490 1332 1214 1234 -1.3 -1.2 -1.0 -1.4 Note that the last four columns are standardized values. From our knowledge of the univariate normal cases, we guess that the observation labeled 9 must be an outlier, since three of the four components are in excess of the 3 sigma distance of the mean 0. Multivariate data have a lot of surprises as we see from the outliers given by the generalized squared distances. We now calculate the generalized squared distances for each of the observations. : mahalanobis{stiff,colMeans(stiff),cov{stiff)) [1] 0.6000129 5.4770196 7.6166439 5.2076093 1.3930776 [29] 6.2337623 2.5333136 As we mentioned earlier, we have a surprise outlier in the observation labeled 16 in addition to that labeled 9. Though each of its components is within the control level sense of the univariate data, the generalized squared distance for observation 16 is unusually high. I]


