Answered step by step
Verified Expert Solution
Question
1 Approved Answer
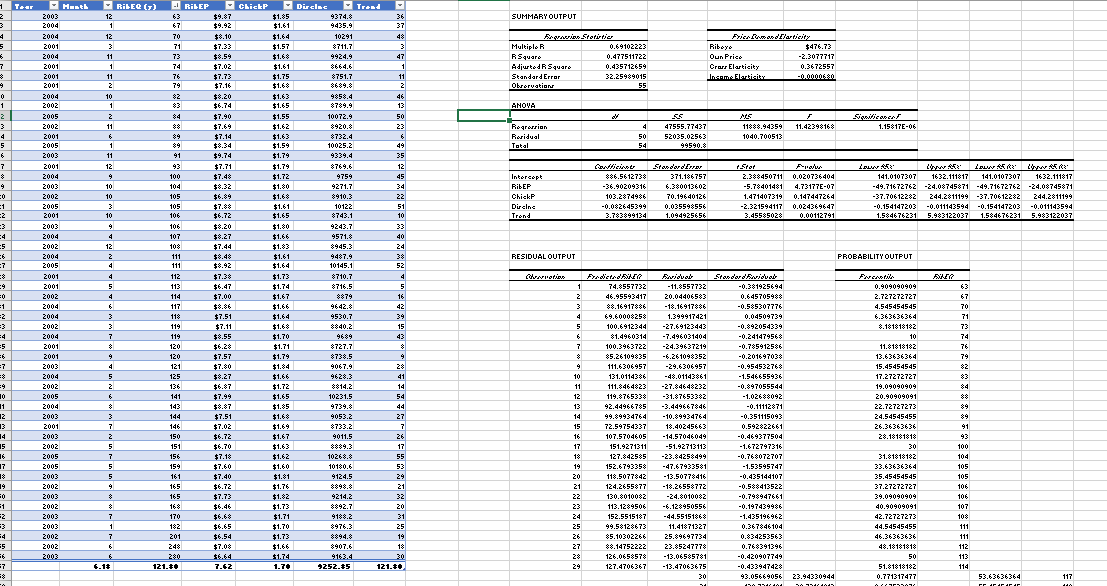
How do we calculate cross, and income elasticity for Chuck_Chicken? 1 Tear Hasth RibEQ (7) RibEP ChickP Disclac Trend 2 2003 12 63 $9.87 $1.85
How do we calculate cross, and income elasticity for Chuck_Chicken?

1 Tear Hasth RibEQ (7) RibEP ChickP Disclac Trend 2 2003 12 63 $9.87 $1.85 9374.8 36 SUMMARY OUTPUT 3 2004 1 67 $9.92 $1.61 9435.9 37 4 2004 12 70 $8.10 $1.64 10291 4% Frasin Statirtier 5 2001 3 71 $7.33 $1.57 $711.7 3 Multiple R 0.69102223 Ribeyo Price Dumond Elasticity 6 2004 11 73 $8.59 $1.68 9924.9 47 RSquare 0.477511722 7 2001 1 74 $7.02 $1.61 8664.6 1 Adjusted R Square 0.435712659 2001 11 76 $7.73 $1.75 $751.7 11 + 2001 2 79 $7.16 $1.68 8689.8 2 0 2004 10 $2 $8.20 $1.63 9858.4 46 1 2002 1 83 $6.74 $1.65 8789.9 13 Standard Errar Observation ANOVA 32.25989015 $476.73 Oun Price Crass Elasticity Income Elasticity -2.3077717 0.3672557 -0.0000680 55 2 2005 2 $4 $7.90 $1.55 10072.9 50 3 2002 11 $$ $7.69 $1.62 $920.8 23 4 2001 6 $9 $7.14 $1.63 $732.4 6 5 2005 1 89 $8.34 $1.59 10025.2 49 Regression Residual Total 4 50 54 55 47555.77437 52035.02563 99590.8 MS Significance 11888.94359 11.42398168 1040.700513 1.15817E-06 6 2003 11 91 $9.74 $1.79 9339.4 35 7 2001 12 93 $7.71 $1.79 $769.6 12 Confficients $ 2004 9 100 $7.48 $1.72 9759 45 Intercopt 9 2003 10 104 $8.32 $1.80 9271.7 34 RibEP :0 2002 10 105 $6.89 $1.68 $910.3 22 ChickP $86.5612738 -36.90209316 103.2874986 1 2005 3 105 $7.88 $1.61 10122 51 Dircinc =2 2001 10 106 $6.72 $1.65 $743.1 10 Trond -0.082645399 3.783899134 StandardError 371.186757 6.380013602 70.19640126 0.035598556 1.094925656 tStat Pralus 2.388450711 0.020736404 -5.78401481 4.73177E-07 1.471407319 0.147447264 -2.321594117 0.024369647 3.45585028 0.00112791 Lou Upper 1632.111817 Upper E Lou R 141.0107307 1632.111817 141.0107307 -49.71672762 -24.08745871 -49.71672762 -24.08745871 -37.70612282 244.2811199 -37.70612282 244.2811199 -0.154147203 -0.011143594 -0.154147203 -0.011143594 1.584676231 5.983122037 1.584676231 5.983122037 3 2003 9 106 $8.20 $1.80 9243.7 33 =4 2004 4 107 $8.27 $1.66 9571. 40 =5 2002 12 108 $7.44 $1.83 $945.3 24 6 2004 2 111 $8.48 $1.61 9487.9 38 RESIDUAL OUTPUT PROBABILITY OUTPUT =7 2005 4 111 $8.92 $1.64 10145.1 52 * 2001 4 112 $7.38 $1.73 $710.7 4 Cervation Fredicted 9 2001 5 113 $6.47 $1.74 $716.5 5 1 74.8557732 =0 2002 4 114 $7.00 $1.67 $879 16 2 46.95593417 Fariduol -11.8557732 20.04406583 Standard Faridab Fercentile FLER -0.381925694 0.909090909 0.645705988 2.727272727 63 67 =1 2004 6 117 $8.86 $1.66 9642.8 42 3 88.16917886 -18.16917886 -0.585307776 4.545454545 70 z 2004 3 11 $7.51 $1.64 9530.7 39 4 69.60008258 3 2002 3 119 $7.11 $1.68 $840.2 15 5 100.6912344 =4 2004 7 119 $8.55 $1.70 9689 43 6 $1.4960314 =5 2001 8 120 $6.28 $1.71 $727.7 7 100.3963722 1.399917421 -27.69123443 -7.496031404 -24.39637219 0.04509739 6.363636364 71 -0.892054339 8.181818182 73 -0.241479568 10 74 -0.785912586 6 2001 9 120 $7.57 $1.79 $738.5 9 $ $5.26109835 -6.261098352 -0.201697038 11.81810182 13.63636364 76 79 7 2003 4 121 $7.80 $1.84 9067.9 28 9 =8 2004 5 125 $8.27 $1.66 9628.3 41 10 =9 2002 2 136 $6.87 $1.72 $814.2 14 11 10 2005 6 141 $7.99 $1.65 10231.5 54 12 111.6306957 131.0114386 -48.01143861 111.8464823 -27.84648232 119.8765338 -31.87653382 -29.6306957 -0.954532768 15.45454545 $2 -1.546655936 17.27272727 $3 -0.897055544 19.09090909 $4 -1.02688092 20.90909091 88 11 2004 8 143 $8.87 $1.85 9739.8 44 13 2 2003 3 144 $7.51 $1.68 9053.2 27 14 13 2001 7 146 $7.02 $1.69 $733.2 7 15 92.44966785 -3.449667846 99.89934764 -10.89934764 72.59754337 -0.11112871 22.72727273 89 -0.351115093 24.54545455 $9 14 2003 2 150 $6.72 $1.67 9011.5 26 16 107.5704605 15 2002 5 151 $6.70 $1.63 _8889.3 17 17 151.9271311 16 2005 7 156 $7.18 $1.62 10268.8 55 18 127.842585 17 2005 5 159 $7.60 $1.60 10180.6 53 19 152.6793358 18.40245663 -14.57046049 -51.92713113 -23.84258499 -47.67933581 0.592822661 26.36363636 91 -0.469377504 28.18181818 93 -1.672797316 30 100 -0.768072707 -1.53595747 31.81818182 33.63636364 104 105 8 2003 5 161 $7.40 $1.81 9124.5 29 20 118.5077842 -13.50778416 -0.435144107 35.45454545 105 9 2002 9 165 $6.72 $1.76 8898.8 21 21 124.2655877 -18.26558772 -0.588413522 37.27272727 106 50 2003 165 $7.73 $1.82 9214.2 32 22 130.8010082 1 2002 8 168 $6.46 $1.73 8892.7 20 23 113.1289506 12 2003 7 170 $6.68 $1.71 9188.2 31 24 152.5515187 -24.8010082 -6.128950556 -44.55151868 -0.798947661 39.09090909 106 -0.197439986 40.90909091 107 -1.435196962 42.72727273 10% 3 2003 1 182 $6.65 $1.70 3976.3 25 25 99.58128673 11.41871327 0.367846104 44.54545455 111 =4 2002 7 201 $6.54 $1.73 8894.8 19 26 $5.10302266 25.89697734 0.834253563 46.36363636 111 5 2002 6 248 $7.08 $1.66 $907.6 18 27 88.14752222 23.85247778 0.768391396 48.18181818 112 =6 2003 6 280 $6.64 $1.74 9163.4 30 28 126.0658578 -13.06585781 -0.420907749 50 113 =7 6.1# 121.0 7.62 1.70 $252.35 121.** 29 127.4706367 -13.47063675 -0.433947428 30 93.05669056 BABALAGA 23.94330944 51.81818182 0.771317477 114 53.63636364 117 A
Step by Step Solution
There are 3 Steps involved in it
Step: 1

Get Instant Access to Expert-Tailored Solutions
See step-by-step solutions with expert insights and AI powered tools for academic success
Step: 2

Step: 3

Ace Your Homework with AI
Get the answers you need in no time with our AI-driven, step-by-step assistance
Get Started


