Answered step by step
Verified Expert Solution
Question
1 Approved Answer
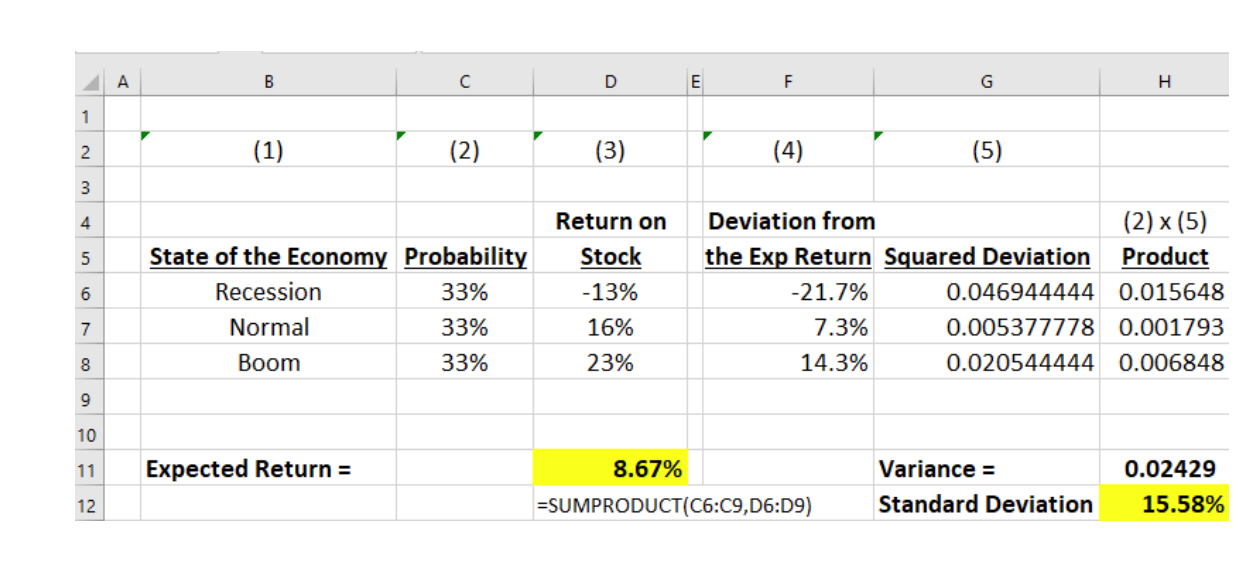
How do we get deviation from the expected return? How do we get squared deviation? And How do I get the product? How Do I
How do we get deviation from the expected return?
How do we get squared deviation?
And How do I get the product?
How Do I get a variant?
And how do I get standard deviation
Please answer all in Excel.
 \begin{tabular}{|c|c|c|c|c|c|c|c|} \hline 4 & A & B & c & D & E & G & H \\ \hline \multicolumn{8}{|l|}{1} \\ \hline 2 & & (1) & (2) & (3) & (4) & (5) & \\ \hline \multicolumn{8}{|l|}{3} \\ \hline 4 & & & & Return on & \multicolumn{2}{|l|}{ Deviation from } & (2)(5) \\ \hline 5 & & State of the Economy & Probability & Stock & the Exp Return & Squared Deviation & Product \\ \hline 6 & & Recession & 33% & 13% & 21.7% & 0.046944444 & 0.015648 \\ \hline 7 & & Normal & 33% & 16% & 7.3% & 0.005377778 & 0.001793 \\ \hline 8 & & Boom & 33% & 23% & 14.3% & 0.020544444 & 0.006848 \\ \hline \multicolumn{8}{|l|}{9} \\ \hline \multicolumn{8}{|l|}{10} \\ \hline 11 & & Expected Return = & & 8.67% & & Variance = & 0.02429 \\ \hline 12 & & & & = SUMPRODUCT ( & (C6:C9,D6:D9) & Standard Deviation & 15.58% \\ \hline \end{tabular}
 Step by Step Solution
There are 3 Steps involved in it
Step: 1

Get Instant Access to Expert-Tailored Solutions
See step-by-step solutions with expert insights and AI powered tools for academic success
Step: 2

Step: 3

Ace Your Homework with AI
Get the answers you need in no time with our AI-driven, step-by-step assistance
Get Started


