

Answered step by step
Verified Expert Solution
Question
1 Approved Answer
how do you calculate a five year trend for a stock of its sales? Annual Data 1 Millions of US $ except per share data
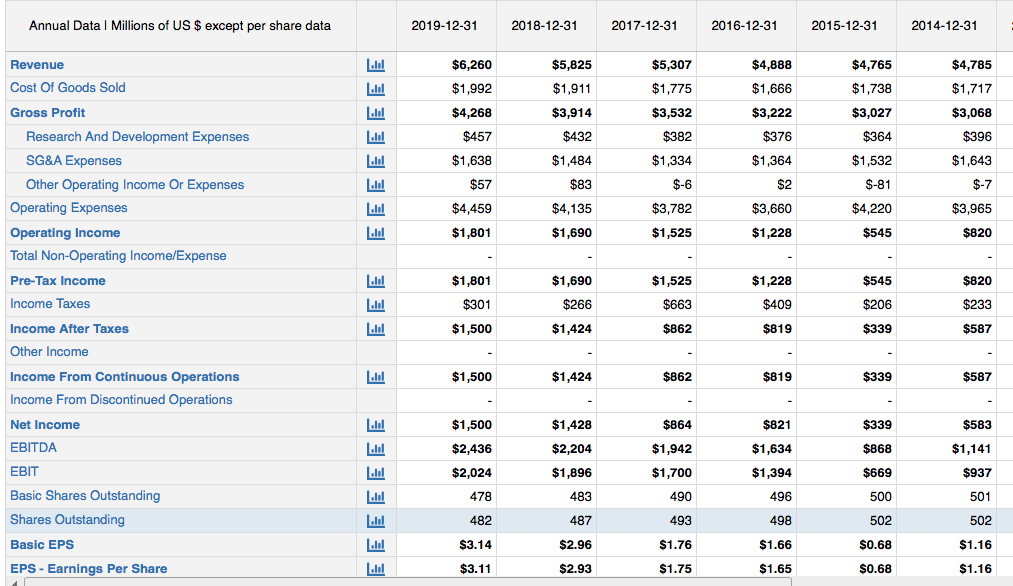
how do you calculate a five year trend for a stock of its sales?
Annual Data 1 Millions of US $ except per share data 2019-12-31 2018-12-31 2017-12-31 2016-12-31 2015-12-31 2014-12-31 $6,260 $5,825 $4,888 $4,765 $5,307 $1,775 $1,992 $4,268 $1,911 $3,914 $1,738 $3,027 $3,532 $457 $432 $382 $364 EEEEEEEE $4,785 $1,717 $3,068 $396 $1,643 $-7 $3,965 $1,638 $57 $4,459 $1,484 $83 $1,666 $3,222 $376 $1,364 $2 $3,660 $1,228 $1,334 $-6 $3,782 $1,525 $1,532 $-81 $4,220 $4,135 $1,690 $1,801 $545 $820 - $1,801 $1,525 $545 $820 $1,690 $266 $1,228 $409 $301 $663 $206 $233 Revenue Cost Of Goods Sold Gross Profit Research And Development Expenses SG&A Expenses Other Operating Income Or Expenses Operating Expenses Operating Income Total Non-Operating Income/Expense Pre-Tax Income Income Taxes Income After Taxes Other Income Income From Continuous Operations Income From Discontinued Operations Net Income EBITDA EBIT Basic Shares Outstanding Shares Outstanding Basic EPS EPS - Earnings Per Share $1,500 $1,424 $862 $819 $339 $587 TE $1,500 $1,424 $862 $819 $339 $587 | lil $1,500 $1,428 $864 $821 $339 $583 $2,436 $2,204 $1,634 $868 $1,141 $1,942 $1,700 [lil $2,024 $1,896 $1,394 $669 $937 | 478 483 490 496 500 501 482 487 493 498 502 502 $3.14 $2.96 $1.76 $1.66 $0.68 $1.16 $3.11 $2.93 $1.75 $1.65 $0.68 $1.16 Annual Data 1 Millions of US $ except per share data 2019-12-31 2018-12-31 2017-12-31 2016-12-31 2015-12-31 2014-12-31 $6,260 $5,825 $4,888 $4,765 $5,307 $1,775 $1,992 $4,268 $1,911 $3,914 $1,738 $3,027 $3,532 $457 $432 $382 $364 EEEEEEEE $4,785 $1,717 $3,068 $396 $1,643 $-7 $3,965 $1,638 $57 $4,459 $1,484 $83 $1,666 $3,222 $376 $1,364 $2 $3,660 $1,228 $1,334 $-6 $3,782 $1,525 $1,532 $-81 $4,220 $4,135 $1,690 $1,801 $545 $820 - $1,801 $1,525 $545 $820 $1,690 $266 $1,228 $409 $301 $663 $206 $233 Revenue Cost Of Goods Sold Gross Profit Research And Development Expenses SG&A Expenses Other Operating Income Or Expenses Operating Expenses Operating Income Total Non-Operating Income/Expense Pre-Tax Income Income Taxes Income After Taxes Other Income Income From Continuous Operations Income From Discontinued Operations Net Income EBITDA EBIT Basic Shares Outstanding Shares Outstanding Basic EPS EPS - Earnings Per Share $1,500 $1,424 $862 $819 $339 $587 TE $1,500 $1,424 $862 $819 $339 $587 | lil $1,500 $1,428 $864 $821 $339 $583 $2,436 $2,204 $1,634 $868 $1,141 $1,942 $1,700 [lil $2,024 $1,896 $1,394 $669 $937 | 478 483 490 496 500 501 482 487 493 498 502 502 $3.14 $2.96 $1.76 $1.66 $0.68 $1.16 $3.11 $2.93 $1.75 $1.65 $0.68 $1.16Step by Step Solution
There are 3 Steps involved in it
Step: 1

Get Instant Access to Expert-Tailored Solutions
See step-by-step solutions with expert insights and AI powered tools for academic success
Step: 2

Step: 3
Ace Your Homework with AI
Get the answers you need in no time with our AI-driven, step-by-step assistance
Get Started
Sport Finance
Authors: Gil Fried, Timothy D. DeSchriver, Michael Mondello
4th Edition
1492559733, 978-1492559733