How do you calculate Beak Even Time and I was wondering how to explain all of my calculations I have already done.
This photo is all my calculations and I am wondering if there are any mistakes or ways I could explain it better on the slide down below.
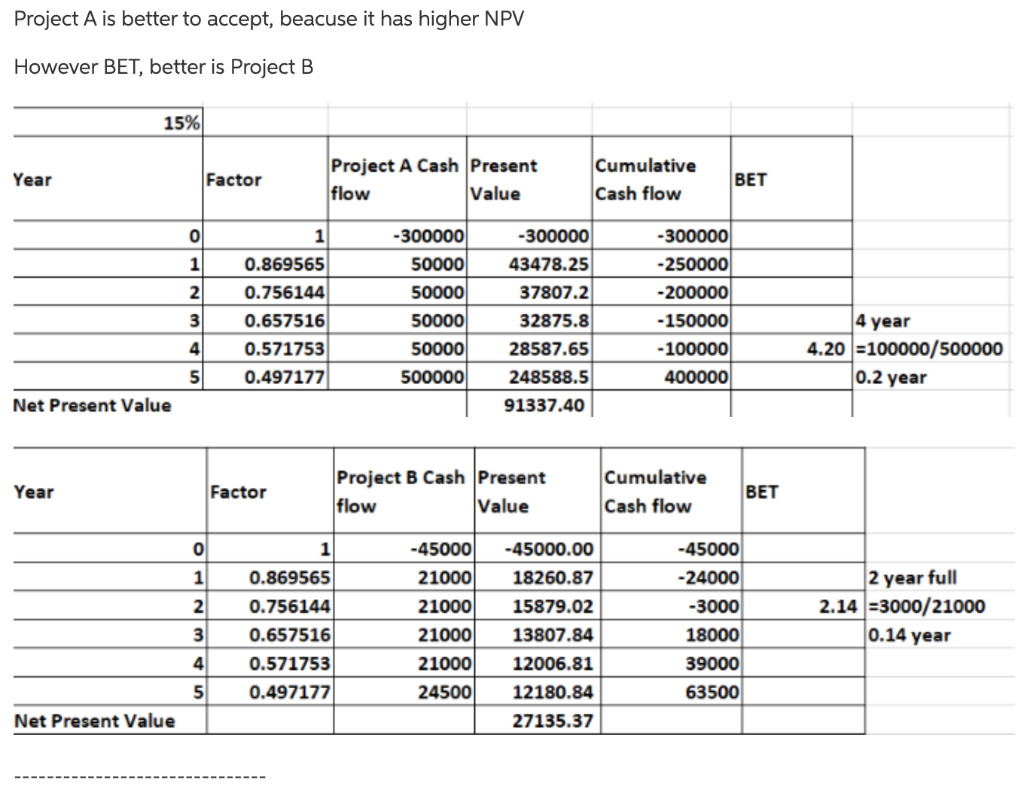
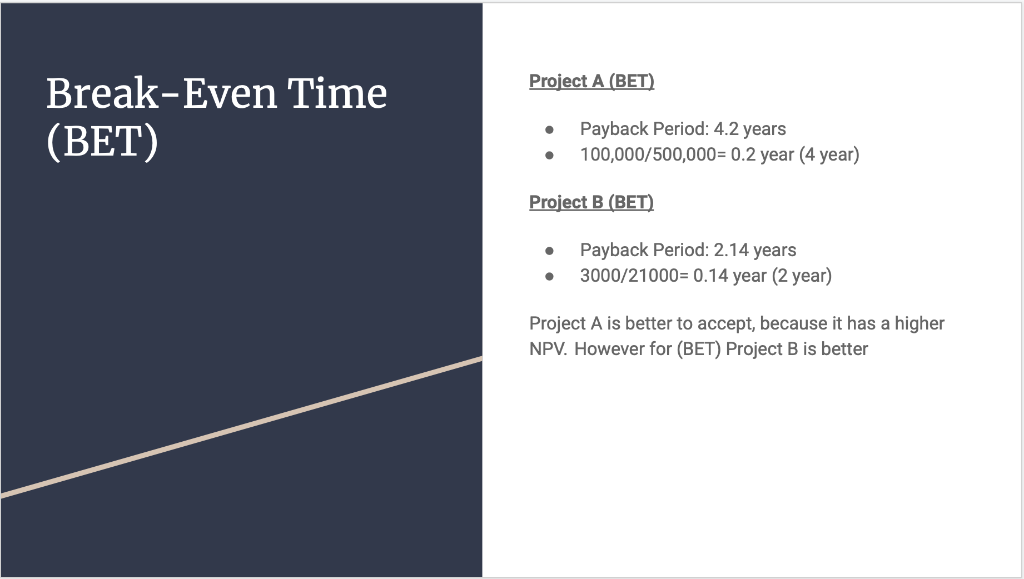
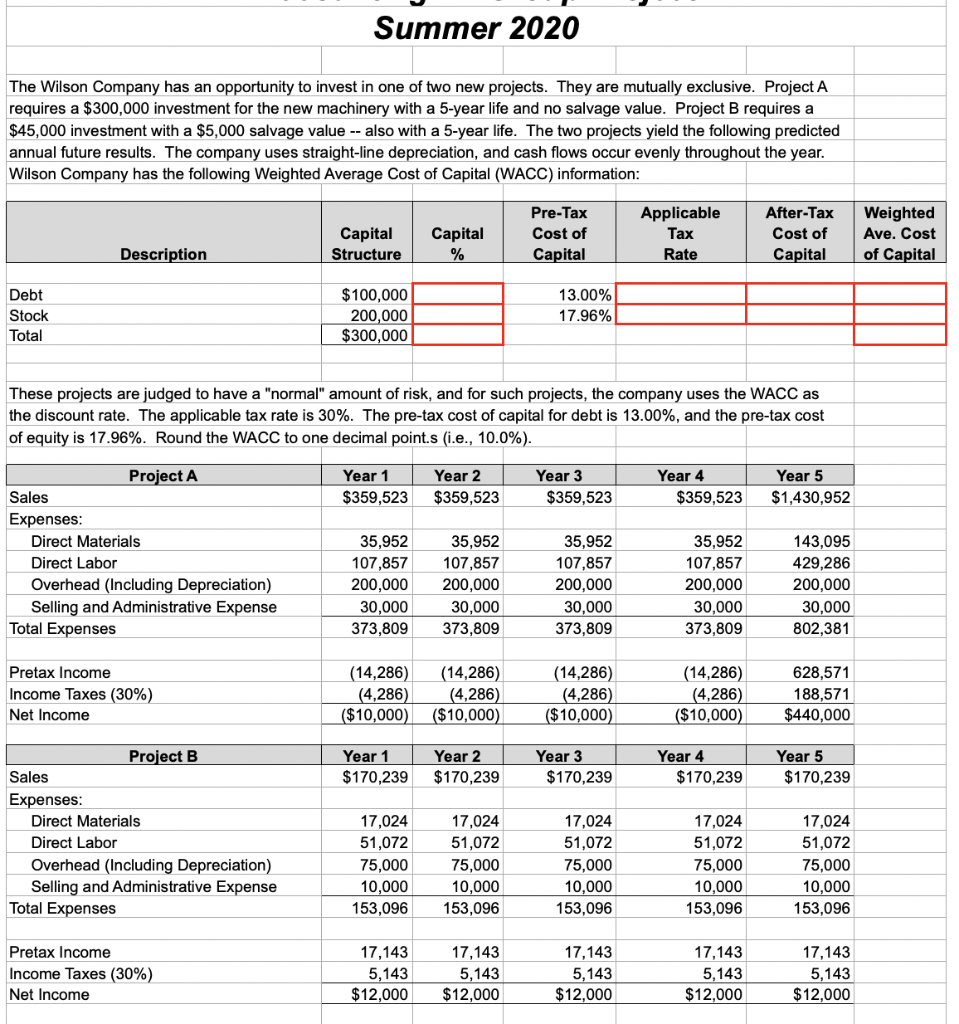
Project A is better to accept, beacuse it has higher NPV However BET, better is Project B 15% Year Factor Project A Cash Present flow Value Cumulative Cash flow BET 0 1 1 2 -300000 50000 50000 50000 50000 500000 0.869565 0.756144 0.657516 0.571753 0.497177 3 -300000 43478.25 37807.2 32875.8 28587.65 248588.5 91337.40 -300000 -250000 -200000 - 150000 -100000 400000 4 year 4 4.20 =100000/500000 5 0.2 year Net Present Value Year Factor Project B Cash Present flow Value Cumulative Cash flow BET 0 1 -45000 21000 1 2 -45000 - 24000 -3000 18000 0.869565 0.756144 0.657516 0.571753 0.497177 21000 21000 -45000.00 18260.87 15879.02 13807.84 12006.81 12180.84 27135.37 3 2 year full 2.14 =3000/21000 0.14 year 4 39000 21000 245001 5 63500 Net Present Value Project A (BET) Break-Even Time (BET) Payback Period: 4.2 years 100,000/500,000= 0.2 year (4 year) . Project B (BET) . Payback Period: 2.14 years 3000/21000= 0.14 year (2 year) . Project A is better to accept, because it has a higher NPV. However for (BET) Project B is better Summer 2020 The Wilson Company has an opportunity to invest in one of two new projects. They are mutually exclusive. Project A requires a $300,000 investment for the new machinery with a 5-year life and no salvage value. Project B requires a $45,000 investment with a $5,000 salvage value -- also with a 5-year life. The two projects yield the following predicted annual future results. The company uses straight-line depreciation, and cash flows occur evenly throughout the year. Wilson Company has the following Weighted Average Cost of Capital (WACC) information: Capital Structure Capital % Pre-Tax Cost of Capital Applicable Tax Rate After-Tax Cost of Capital Weighted Ave. Cost of Capital Description Debt Stock Total $100,000 200,000 $300,000 13.00% 17.96% These projects are judged to have a "normal" amount of risk, and for such projects, the company uses the WACC as the discount rate. The applicable tax rate is 30%. The pre-tax cost of capital for debt is 13.00%, and the pre-tax cost of equity is 17.96%. Round the WACC to one decimal point.s (i.e., 10.0%). Year 2 Year 1 $359,523 Year 3 $359,523 Year 4 $359,523 $359,523 Year 5 $1,430,952 Project A Sales Expenses: Direct Materials Direct Labor Overhead (Including Depreciation) Selling and Administrative Expense Total Expenses 35,952 107,857 200,000 30,000 373,809 35,952 107,857 200,000 30,000 373,809 35,952 107,857 200,000 30,000 373,809 35,952 107,857 200.000 30,000 373,809 143,095 429,286 200,000 30,000 802,381 Pretax Income Income Taxes (30%) Net Income (14,286) (14,286) (4,286) (4,286) ($10,000) ($10,000) (14,286) (4,286) ($10,000) (14,286) (4,286) ($10,000) 628,571 188,571 $440,000 Year 1 $170,239 Year 2 $170,239 Year 3 $170,239 Year 4 $170,239 Year 5 $170,239 Project B Sales Expenses: Direct Materials Direct Labor Overhead (Including Depreciation) Selling and Administrative Expense Total Expenses 17,024 51,072 75,000 10,000 153,096 17,024 51,072 75,000 10,000 153,096 17,024 51,072 75,000 10,000 153,096 17,024 51,072 75,000 10,000 153,096 17,024 51,072 75,000 10,000 153,096 Pretax Income Income Taxes (30%) Net Income 17,143 5,143 $12,000 17,143 5,143 $12,000 17,143 5,143 $12,000 17,143 5,143 $12,000 17,143 5,143 $12,000 Project A is better to accept, beacuse it has higher NPV However BET, better is Project B 15% Year Factor Project A Cash Present flow Value Cumulative Cash flow BET 0 1 1 2 -300000 50000 50000 50000 50000 500000 0.869565 0.756144 0.657516 0.571753 0.497177 3 -300000 43478.25 37807.2 32875.8 28587.65 248588.5 91337.40 -300000 -250000 -200000 - 150000 -100000 400000 4 year 4 4.20 =100000/500000 5 0.2 year Net Present Value Year Factor Project B Cash Present flow Value Cumulative Cash flow BET 0 1 -45000 21000 1 2 -45000 - 24000 -3000 18000 0.869565 0.756144 0.657516 0.571753 0.497177 21000 21000 -45000.00 18260.87 15879.02 13807.84 12006.81 12180.84 27135.37 3 2 year full 2.14 =3000/21000 0.14 year 4 39000 21000 245001 5 63500 Net Present Value Project A (BET) Break-Even Time (BET) Payback Period: 4.2 years 100,000/500,000= 0.2 year (4 year) . Project B (BET) . Payback Period: 2.14 years 3000/21000= 0.14 year (2 year) . Project A is better to accept, because it has a higher NPV. However for (BET) Project B is better Summer 2020 The Wilson Company has an opportunity to invest in one of two new projects. They are mutually exclusive. Project A requires a $300,000 investment for the new machinery with a 5-year life and no salvage value. Project B requires a $45,000 investment with a $5,000 salvage value -- also with a 5-year life. The two projects yield the following predicted annual future results. The company uses straight-line depreciation, and cash flows occur evenly throughout the year. Wilson Company has the following Weighted Average Cost of Capital (WACC) information: Capital Structure Capital % Pre-Tax Cost of Capital Applicable Tax Rate After-Tax Cost of Capital Weighted Ave. Cost of Capital Description Debt Stock Total $100,000 200,000 $300,000 13.00% 17.96% These projects are judged to have a "normal" amount of risk, and for such projects, the company uses the WACC as the discount rate. The applicable tax rate is 30%. The pre-tax cost of capital for debt is 13.00%, and the pre-tax cost of equity is 17.96%. Round the WACC to one decimal point.s (i.e., 10.0%). Year 2 Year 1 $359,523 Year 3 $359,523 Year 4 $359,523 $359,523 Year 5 $1,430,952 Project A Sales Expenses: Direct Materials Direct Labor Overhead (Including Depreciation) Selling and Administrative Expense Total Expenses 35,952 107,857 200,000 30,000 373,809 35,952 107,857 200,000 30,000 373,809 35,952 107,857 200,000 30,000 373,809 35,952 107,857 200.000 30,000 373,809 143,095 429,286 200,000 30,000 802,381 Pretax Income Income Taxes (30%) Net Income (14,286) (14,286) (4,286) (4,286) ($10,000) ($10,000) (14,286) (4,286) ($10,000) (14,286) (4,286) ($10,000) 628,571 188,571 $440,000 Year 1 $170,239 Year 2 $170,239 Year 3 $170,239 Year 4 $170,239 Year 5 $170,239 Project B Sales Expenses: Direct Materials Direct Labor Overhead (Including Depreciation) Selling and Administrative Expense Total Expenses 17,024 51,072 75,000 10,000 153,096 17,024 51,072 75,000 10,000 153,096 17,024 51,072 75,000 10,000 153,096 17,024 51,072 75,000 10,000 153,096 17,024 51,072 75,000 10,000 153,096 Pretax Income Income Taxes (30%) Net Income 17,143 5,143 $12,000 17,143 5,143 $12,000 17,143 5,143 $12,000 17,143 5,143 $12,000 17,143 5,143 $12,000