Answered step by step
Verified Expert Solution
Question
1 Approved Answer
How do you figure out the market share for each product and region by month based on the sales date and the average market share
How do you figure out the market share for each product and region by month based on the sales date and the average market share by region over 5 years in excel? Can you tell me steps to follow in order to do this task? I provided a table of the PLE products for the past five years.
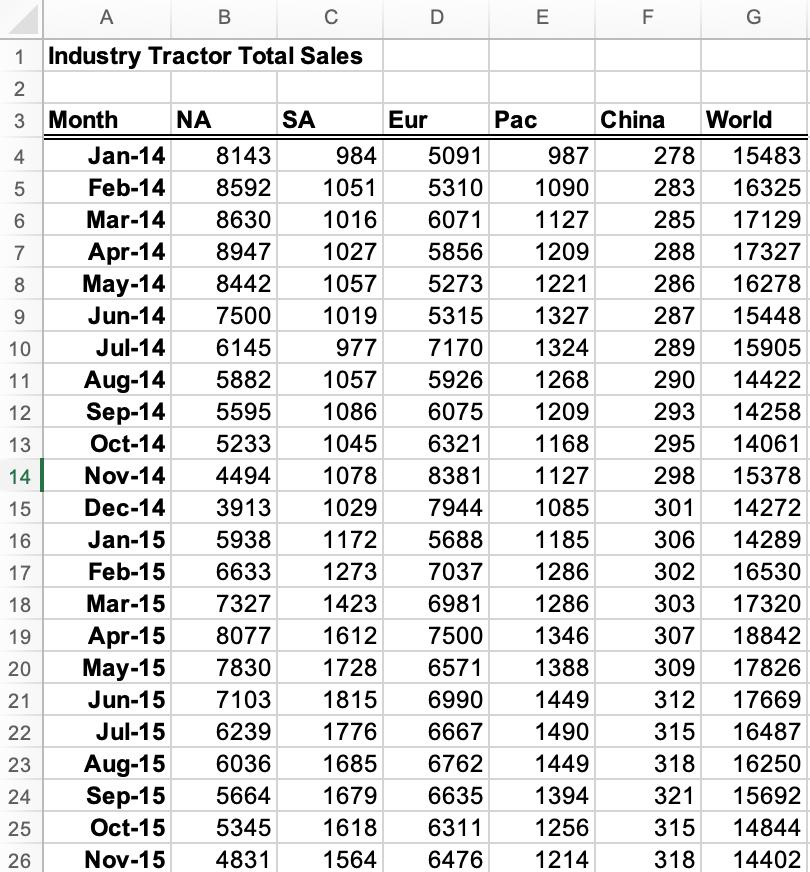
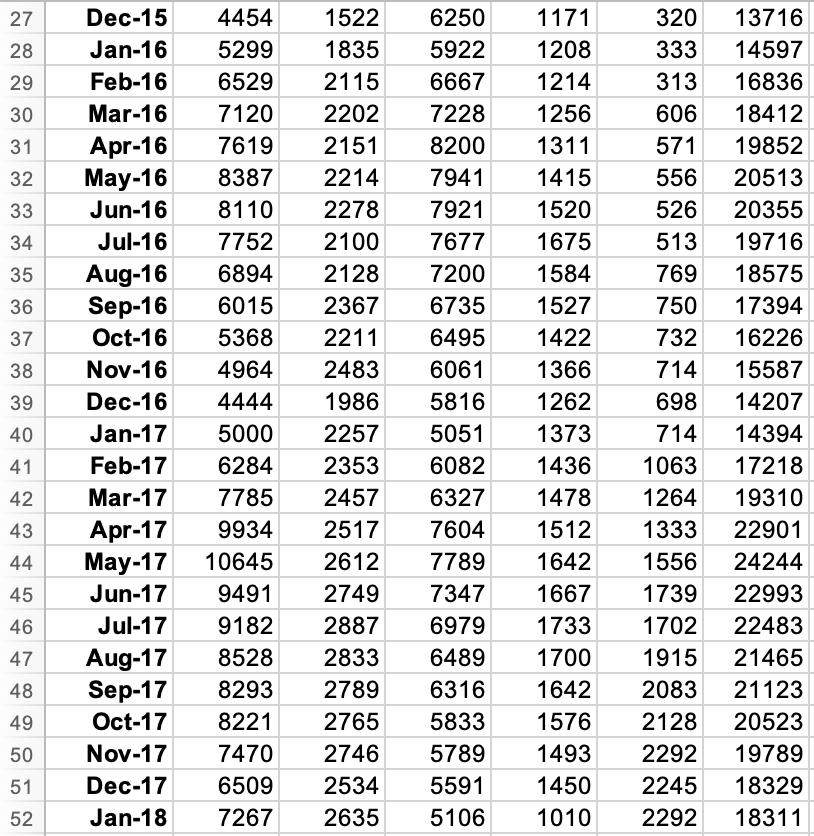
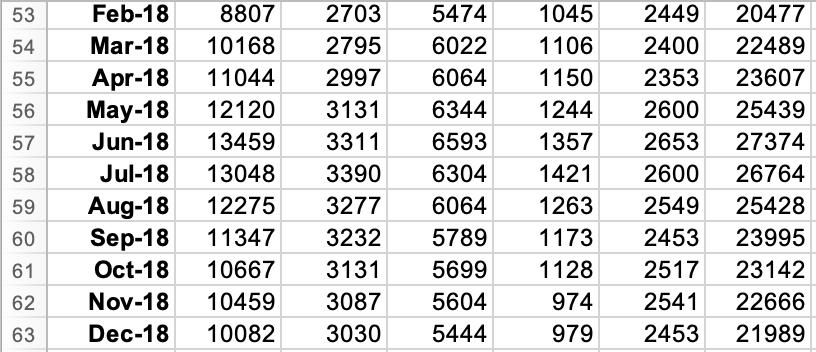
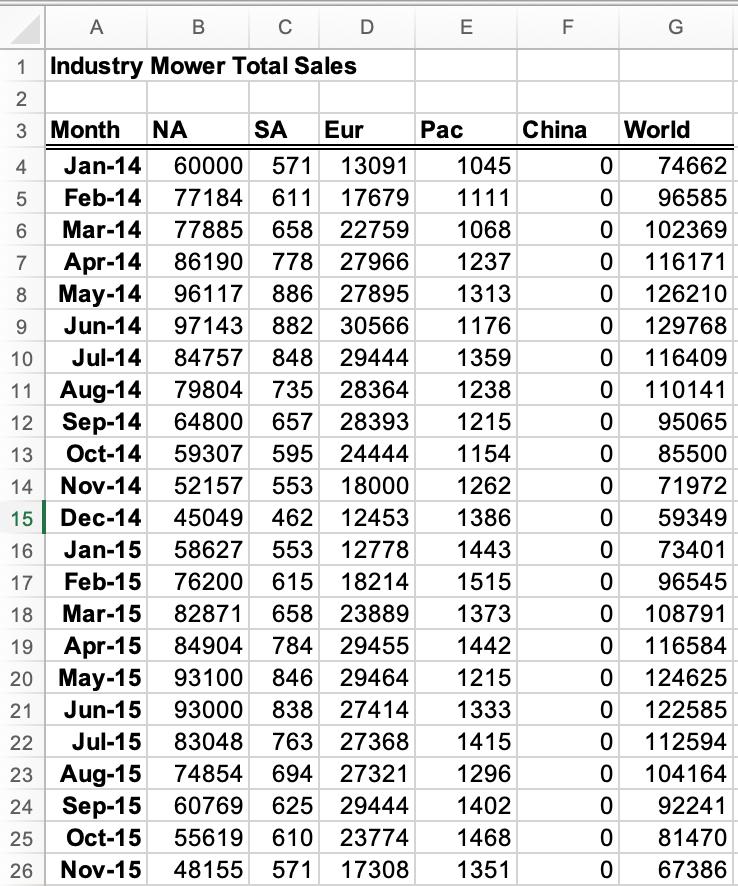
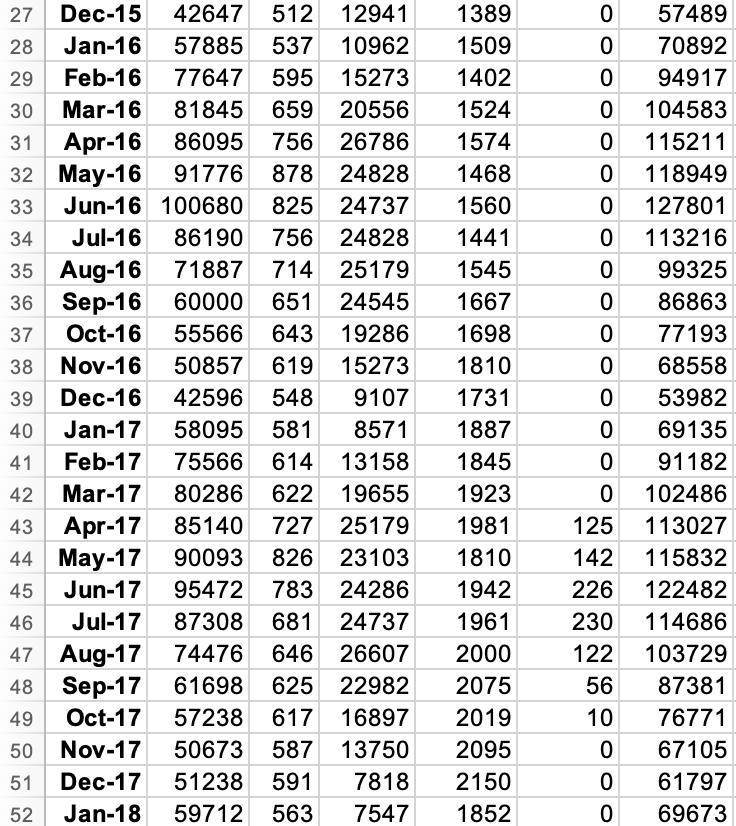
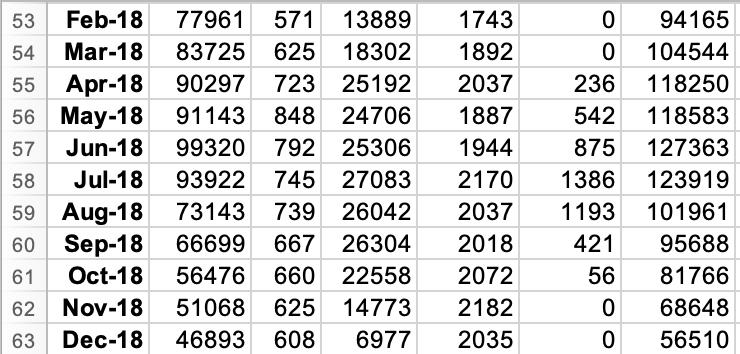

A C 1 Industry Tractor Total Sales 2 3 Month B SA Eur D E Pac 4 Jan-14 8143 984 5091 987 5 Feb-14 8592 1051 5310 1090 6 Mar-14 8630 1016 6071 1127 7 Apr-14 8947 1027 5856 1209 8 May-14 8442 1057 5273 1221 9 Jun-14 7500 1019 5315 1327 10 Jul-14 6145 977 7170 1324 11 Aug-14 5882 1057 5926 1268 12 Sep-14 5595 1086 6075 1209 13 Oct-14 5233 1045 6321 1168 14 Nov-14 4494 1078 8381 1127 15 Dec-14 3913 1029 7944 1085 16 Jan-15 5938 1172 5688 1185 17 Feb-15 6633 1273 7037 1286 18 Mar-15 7327 1423 6981 1286 19 Apr-15 7500 1346 8077 1612 May-15 7830 1728 6571 20 1388 21 Jun-15 7103 1815 6990 1449 22 Jul-15 6239 1776 6667 1490 23 Aug-15 6036 1685 6762 1449 24 Sep-15 5664 1679 6635 1394 25 5345 1618 6311 1256 Oct-15 Nov-15 4831 26 1564 6476 1214 F China G World 278 15483 283 16325 285 17129 288 17327 286 16278 287 15448 289 15905 290 14422 293 14258 295 14061 298 15378 301 14272 306 14289 302 16530 303 17320 307 18842 309 17826 312 17669 315 16487 318 16250 321 15692 315 14844 318 14402
Step by Step Solution
★★★★★
3.42 Rating (152 Votes )
There are 3 Steps involved in it
Step: 1
Mower Unit Sales Month SA Europe Pacific Jan10 6000 200 720 100 Feb10 7950 220 990 120 Mar10 8100 25...
Get Instant Access to Expert-Tailored Solutions
See step-by-step solutions with expert insights and AI powered tools for academic success
Step: 2

Step: 3

Ace Your Homework with AI
Get the answers you need in no time with our AI-driven, step-by-step assistance
Get Started


