Answered step by step
Verified Expert Solution
Question
1 Approved Answer
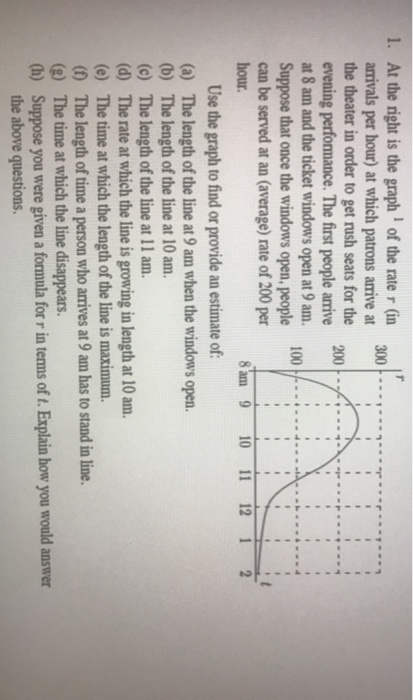
how do you find the arrivals from the graph? please be more details. Thank you! the question doesn't have the equation of the curve 1.
how do you find the arrivals from the graph? please be more details.
Thank you! 

the question doesn't have the equation of the curve
1. At the right is the graph of the rate r (in 300 arrivals per hour) at which patrons arrive at the theater in order to get rush seats for the 200 evening performance. The first people arrive at 8 am and the ticket windows open at 9 am. 100 Suppose that once the windows open, people can be served at an (average) rate of 200 per hour. 8 am 9 10 11 121 Use the graph to find or provide an estimate of: (a) The length of the line at 9 am when the windows open. (b) The length of the line at 10 am. (c) The length of the line at 11 am. (d) The rate at which the line is growing in length at 10 am. (e) The time at which the length of the line is maximum. (1) The length of time a person who arrives at 9 am has to stand in line. (g) The time at which the line disappears. (h) Suppose you were given a formula for r in terms of t. Explain how you would answer the above questions Step by Step Solution
There are 3 Steps involved in it
Step: 1

Get Instant Access to Expert-Tailored Solutions
See step-by-step solutions with expert insights and AI powered tools for academic success
Step: 2

Step: 3

Ace Your Homework with AI
Get the answers you need in no time with our AI-driven, step-by-step assistance
Get Started


