

Answered step by step
Verified Expert Solution
Question
1 Approved Answer
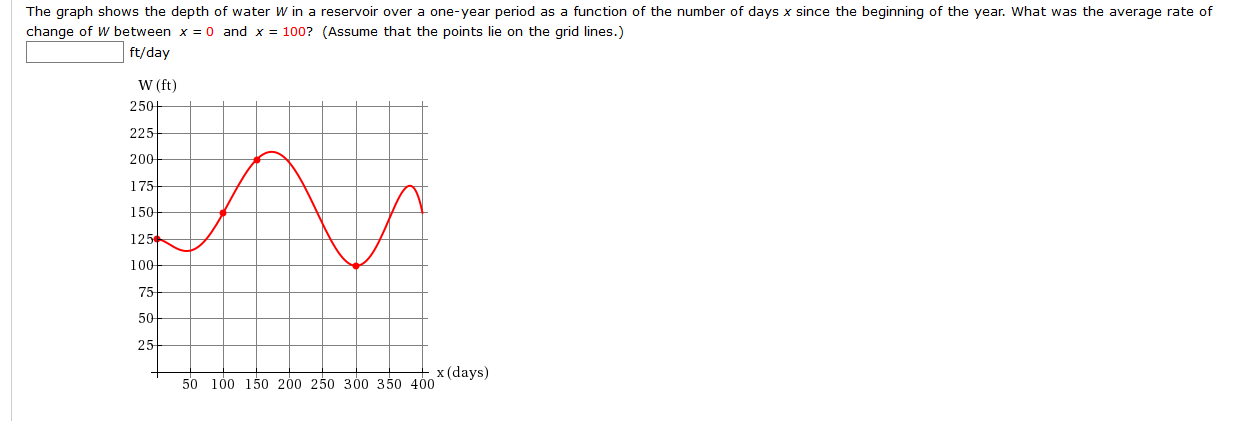
How do you find the average rate of change in this. The graph shows the depth of water W in a reservoir over a one-year
How do you find the average rate of change in this.
Step by Step Solution
There are 3 Steps involved in it
Step: 1

Get Instant Access to Expert-Tailored Solutions
See step-by-step solutions with expert insights and AI powered tools for academic success
Step: 2

Step: 3
Ace Your Homework with AI
Get the answers you need in no time with our AI-driven, step-by-step assistance
Get Started
Numerical Analysis
Authors: Richard L. Burden, J. Douglas Faires
9th edition
538733519, 978-1133169338, 1133169333, 978-0538733519