Answered step by step
Verified Expert Solution
Question
1 Approved Answer
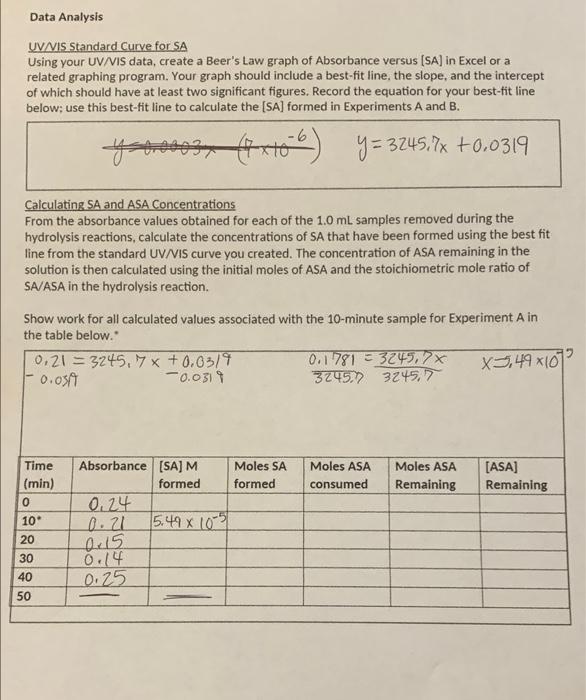
how do you find the moles of SA (salicylic acid) formed, the moles of ASA (solid salicylic acid) consumed, and the moles of ASA remaining?
how do you find the moles of SA (salicylic acid) formed, the moles of ASA (solid salicylic acid) consumed, and the moles of ASA remaining? 
Data Analysis UV/VIS Standard Curve for SA Using your UV/VIS data, create a Beer's Law graph of Absorbance versus (SA) in Excel or a related graphing program. Your graph should include a best-fit line, the slope, and the intercept of which should have at least two significant figures. Record the equation for your best-fit line below; use this best-fit line to calculate the [SA] formed in Experiments A and B. ****** xt66) y = 3245.7x +0.0319 Calculating SA and ASA Concentrations From the absorbance values obtained for each of the 1.0 mL samples removed during the hydrolysis reactions, calculate the concentrations of SA that have been formed using the best fit line from the standard UV/VIS curve you created. The concentration of ASA remaining in the solution is then calculated using the initial moles of ASA and the stoichiometric mole ratio of SA/ASA in the hydrolysis reaction. Show work for all calculated values associated with the 10-minute sample for Experiment A in the table below. 0.21 = 3245.7 x +0.0319 0.1781 33249,7x x3,49x107 -0.059 0.0311 32452) 3245,7 Moles ASA consumed Moles ASA Remaining [ASA] Remaining Time (min) 0 10 20 Absorbance (SA) M Moles SA formed formed 0.24 0.21 5,49 x 1051 aris 0.14 0.25 30 40 50 Data Analysis UV/VIS Standard Curve for SA Using your UV/VIS data, create a Beer's Law graph of Absorbance versus (SA) in Excel or a related graphing program. Your graph should include a best-fit line, the slope, and the intercept of which should have at least two significant figures. Record the equation for your best-fit line below; use this best-fit line to calculate the [SA] formed in Experiments A and B. ****** xt66) y = 3245.7x +0.0319 Calculating SA and ASA Concentrations From the absorbance values obtained for each of the 1.0 mL samples removed during the hydrolysis reactions, calculate the concentrations of SA that have been formed using the best fit line from the standard UV/VIS curve you created. The concentration of ASA remaining in the solution is then calculated using the initial moles of ASA and the stoichiometric mole ratio of SA/ASA in the hydrolysis reaction. Show work for all calculated values associated with the 10-minute sample for Experiment A in the table below. 0.21 = 3245.7 x +0.0319 0.1781 33249,7x x3,49x107 -0.059 0.0311 32452) 3245,7 Moles ASA consumed Moles ASA Remaining [ASA] Remaining Time (min) 0 10 20 Absorbance (SA) M Moles SA formed formed 0.24 0.21 5,49 x 1051 aris 0.14 0.25 30 40 50 
Step by Step Solution
There are 3 Steps involved in it
Step: 1

Get Instant Access to Expert-Tailored Solutions
See step-by-step solutions with expert insights and AI powered tools for academic success
Step: 2

Step: 3

Ace Your Homework with AI
Get the answers you need in no time with our AI-driven, step-by-step assistance
Get Started


