Answered step by step
Verified Expert Solution
Question
1 Approved Answer
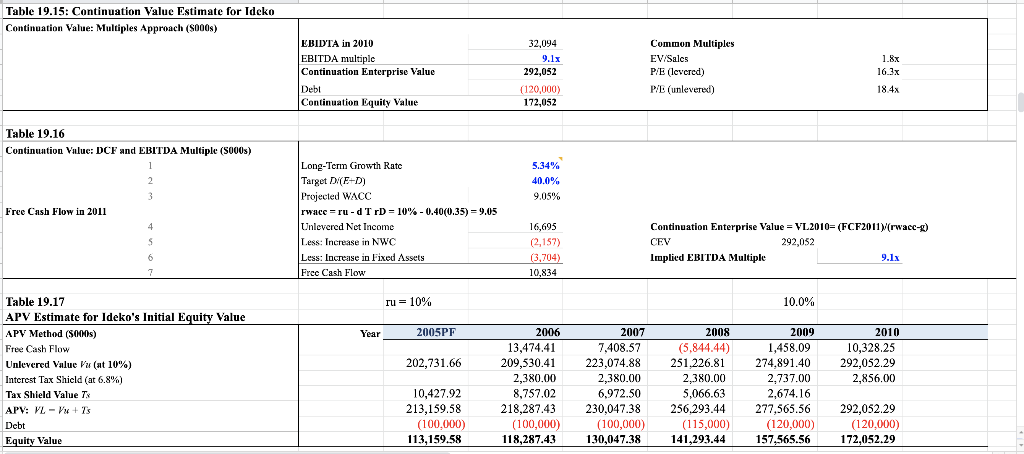
How do you get the red highlighted number, what is the formula? Table 19.15: Continuation Value Estimate for Ideko Continuation Value: Multiples Approach (5000) EBIDTA

How do you get the red highlighted number, what is the formula?
Table 19.15: Continuation Value Estimate for Ideko Continuation Value: Multiples Approach (5000) EBIDTA in 2010 EBITDA multiple Continuation Enterprise Value Debt Continuation Equity Value 32,094 9.1x 292,052 Common Multiples EV/Sales P/E (levered) PE (unlevered) 1.8x 16.3x 18.4x (120,000) 172,052 Table 19.16 Continuation Value: DCF and EBITDA Multiple (5000s) 1 2 3 Free Cash Flow in 2011 5.34% 40.0% 9.05% Long-Term Growth Rate Target D(ED) Projected WACC rwace = ru-d TrD = 10% - 0.40(0.35) = 9.05 Unlevered Net Income Less: Increase in NWC Less: Increase in Fixed Assets Free Cash Flow 4 S 16,695 (2,157) (3,704) 10,834 Continuation Enterprise Value = V1.2010= (FCF2011)(rwacc-g) CEV 292,052 Implied EBITDA Multiple 9.1x 6 7 ru= 10% 10.0% Year 2005PF 2009 1,458.09 274,891.40 202,731.66 Table 19.17 APV Estimate for Ideko's Initial Equity Value APV Method (5000) Free Cash Flow Unlevered Value Vu (at 10%) Interest Tax Shield (at 6.8%) %) Tax Shield Value Ts APV: VL - V+ Debt Equity Value 2010 10,328.25 292,052.29 2,856.00 2006 13,474.41 209,530.41 2,380.00 8,757.02 218,287.43 (100,000) 118,287.43 2007 7,408.57 223,074.88 2,380.00 6,972.50 230,047.38 (100,000) 130,047.38 2008 (5.844.44) 251.226.81 2,380.00 5,066.63 256.293.44 (115,000) 141,293.44 2,737.00 10,427.92 213,159.58 (100,000) 113,159.58 2,674.16 277,565.56 (120,000) 157,565.56 292,052.29 (120,000) 172,052.29 Table 19.15: Continuation Value Estimate for Ideko Continuation Value: Multiples Approach (5000) EBIDTA in 2010 EBITDA multiple Continuation Enterprise Value Debt Continuation Equity Value 32,094 9.1x 292,052 Common Multiples EV/Sales P/E (levered) PE (unlevered) 1.8x 16.3x 18.4x (120,000) 172,052 Table 19.16 Continuation Value: DCF and EBITDA Multiple (5000s) 1 2 3 Free Cash Flow in 2011 5.34% 40.0% 9.05% Long-Term Growth Rate Target D(ED) Projected WACC rwace = ru-d TrD = 10% - 0.40(0.35) = 9.05 Unlevered Net Income Less: Increase in NWC Less: Increase in Fixed Assets Free Cash Flow 4 S 16,695 (2,157) (3,704) 10,834 Continuation Enterprise Value = V1.2010= (FCF2011)(rwacc-g) CEV 292,052 Implied EBITDA Multiple 9.1x 6 7 ru= 10% 10.0% Year 2005PF 2009 1,458.09 274,891.40 202,731.66 Table 19.17 APV Estimate for Ideko's Initial Equity Value APV Method (5000) Free Cash Flow Unlevered Value Vu (at 10%) Interest Tax Shield (at 6.8%) %) Tax Shield Value Ts APV: VL - V+ Debt Equity Value 2010 10,328.25 292,052.29 2,856.00 2006 13,474.41 209,530.41 2,380.00 8,757.02 218,287.43 (100,000) 118,287.43 2007 7,408.57 223,074.88 2,380.00 6,972.50 230,047.38 (100,000) 130,047.38 2008 (5.844.44) 251.226.81 2,380.00 5,066.63 256.293.44 (115,000) 141,293.44 2,737.00 10,427.92 213,159.58 (100,000) 113,159.58 2,674.16 277,565.56 (120,000) 157,565.56 292,052.29 (120,000) 172,052.29Step by Step Solution
There are 3 Steps involved in it
Step: 1

Get Instant Access to Expert-Tailored Solutions
See step-by-step solutions with expert insights and AI powered tools for academic success
Step: 2

Step: 3

Ace Your Homework with AI
Get the answers you need in no time with our AI-driven, step-by-step assistance
Get Started


