Answered step by step
Verified Expert Solution
Link Copied!

Question

1 Approved Answer

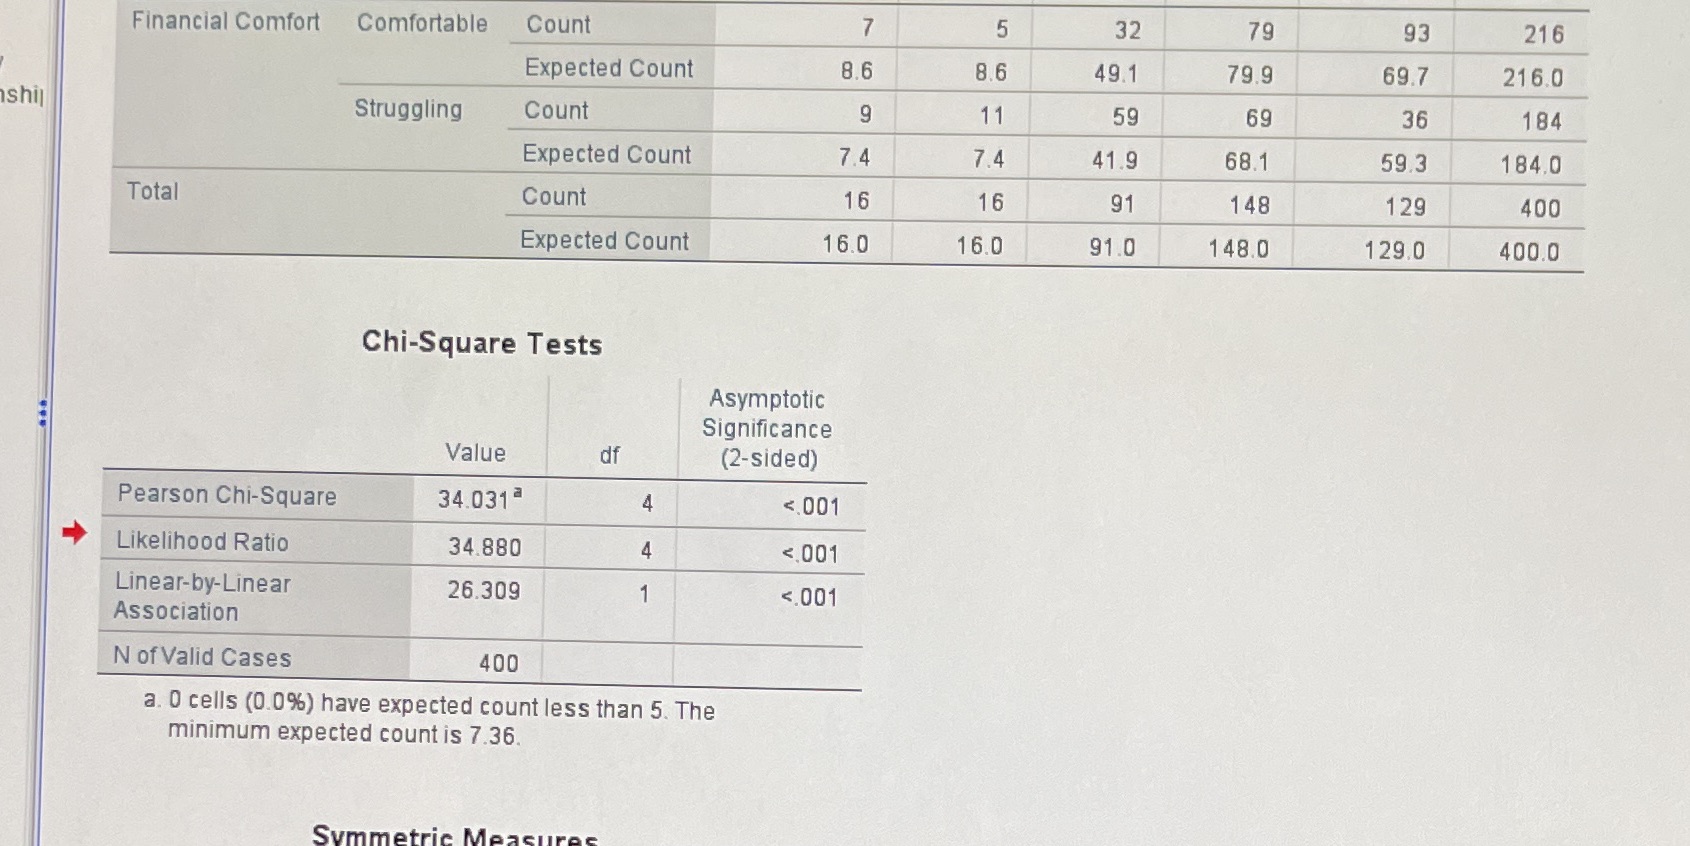
How do you interpret this data ? Financial Comfort Comfortable Count 7 5 32 79 93 216 Expected Count 8.6 8.6 49.1 79.9 69.7 216.0

How do you interpret this data ?

image text in transcribed
Financial Comfort Comfortable Count 7 5 32 79 93 216 Expected Count 8.6 8.6 49.1 79.9 69.7 216.0 shij Struggling Count 9 11 59 69 36 184 Expected Count 7.4 7.4 41.9 68.1 59 3 184.0 Total Count 16 16 91 148 129 400 Expected Count 16.0 16.0 91.0 148.0 129.0 400.0 Chi-Square Tests Asymptotic Significance Value df (2-sided) Pearson Chi-Square 34.031 4 <.001 likelihood ratio linear-by-linear association n of valid cases a. cells have expected count less than the minimum is symmetric mea>

Step by Step Solution

There are 3 Steps involved in it

Step: 1

blur-text-image

Get Instant Access to Expert-Tailored Solutions

See step-by-step solutions with expert insights and AI powered tools for academic success

Step: 2

blur-text-image

Step: 3

blur-text-image

Ace Your Homework with AI

Get the answers you need in no time with our AI-driven, step-by-step assistance

Get Started

Recommended Textbook for

Advanced Engineering Mathematics

Authors: ERWIN KREYSZIG

9th Edition

0471488852, 978-0471488859

More Books

Students also viewed these Mathematics questions