Answered step by step
Verified Expert Solution
Link Copied!

Question

1 Approved Answer

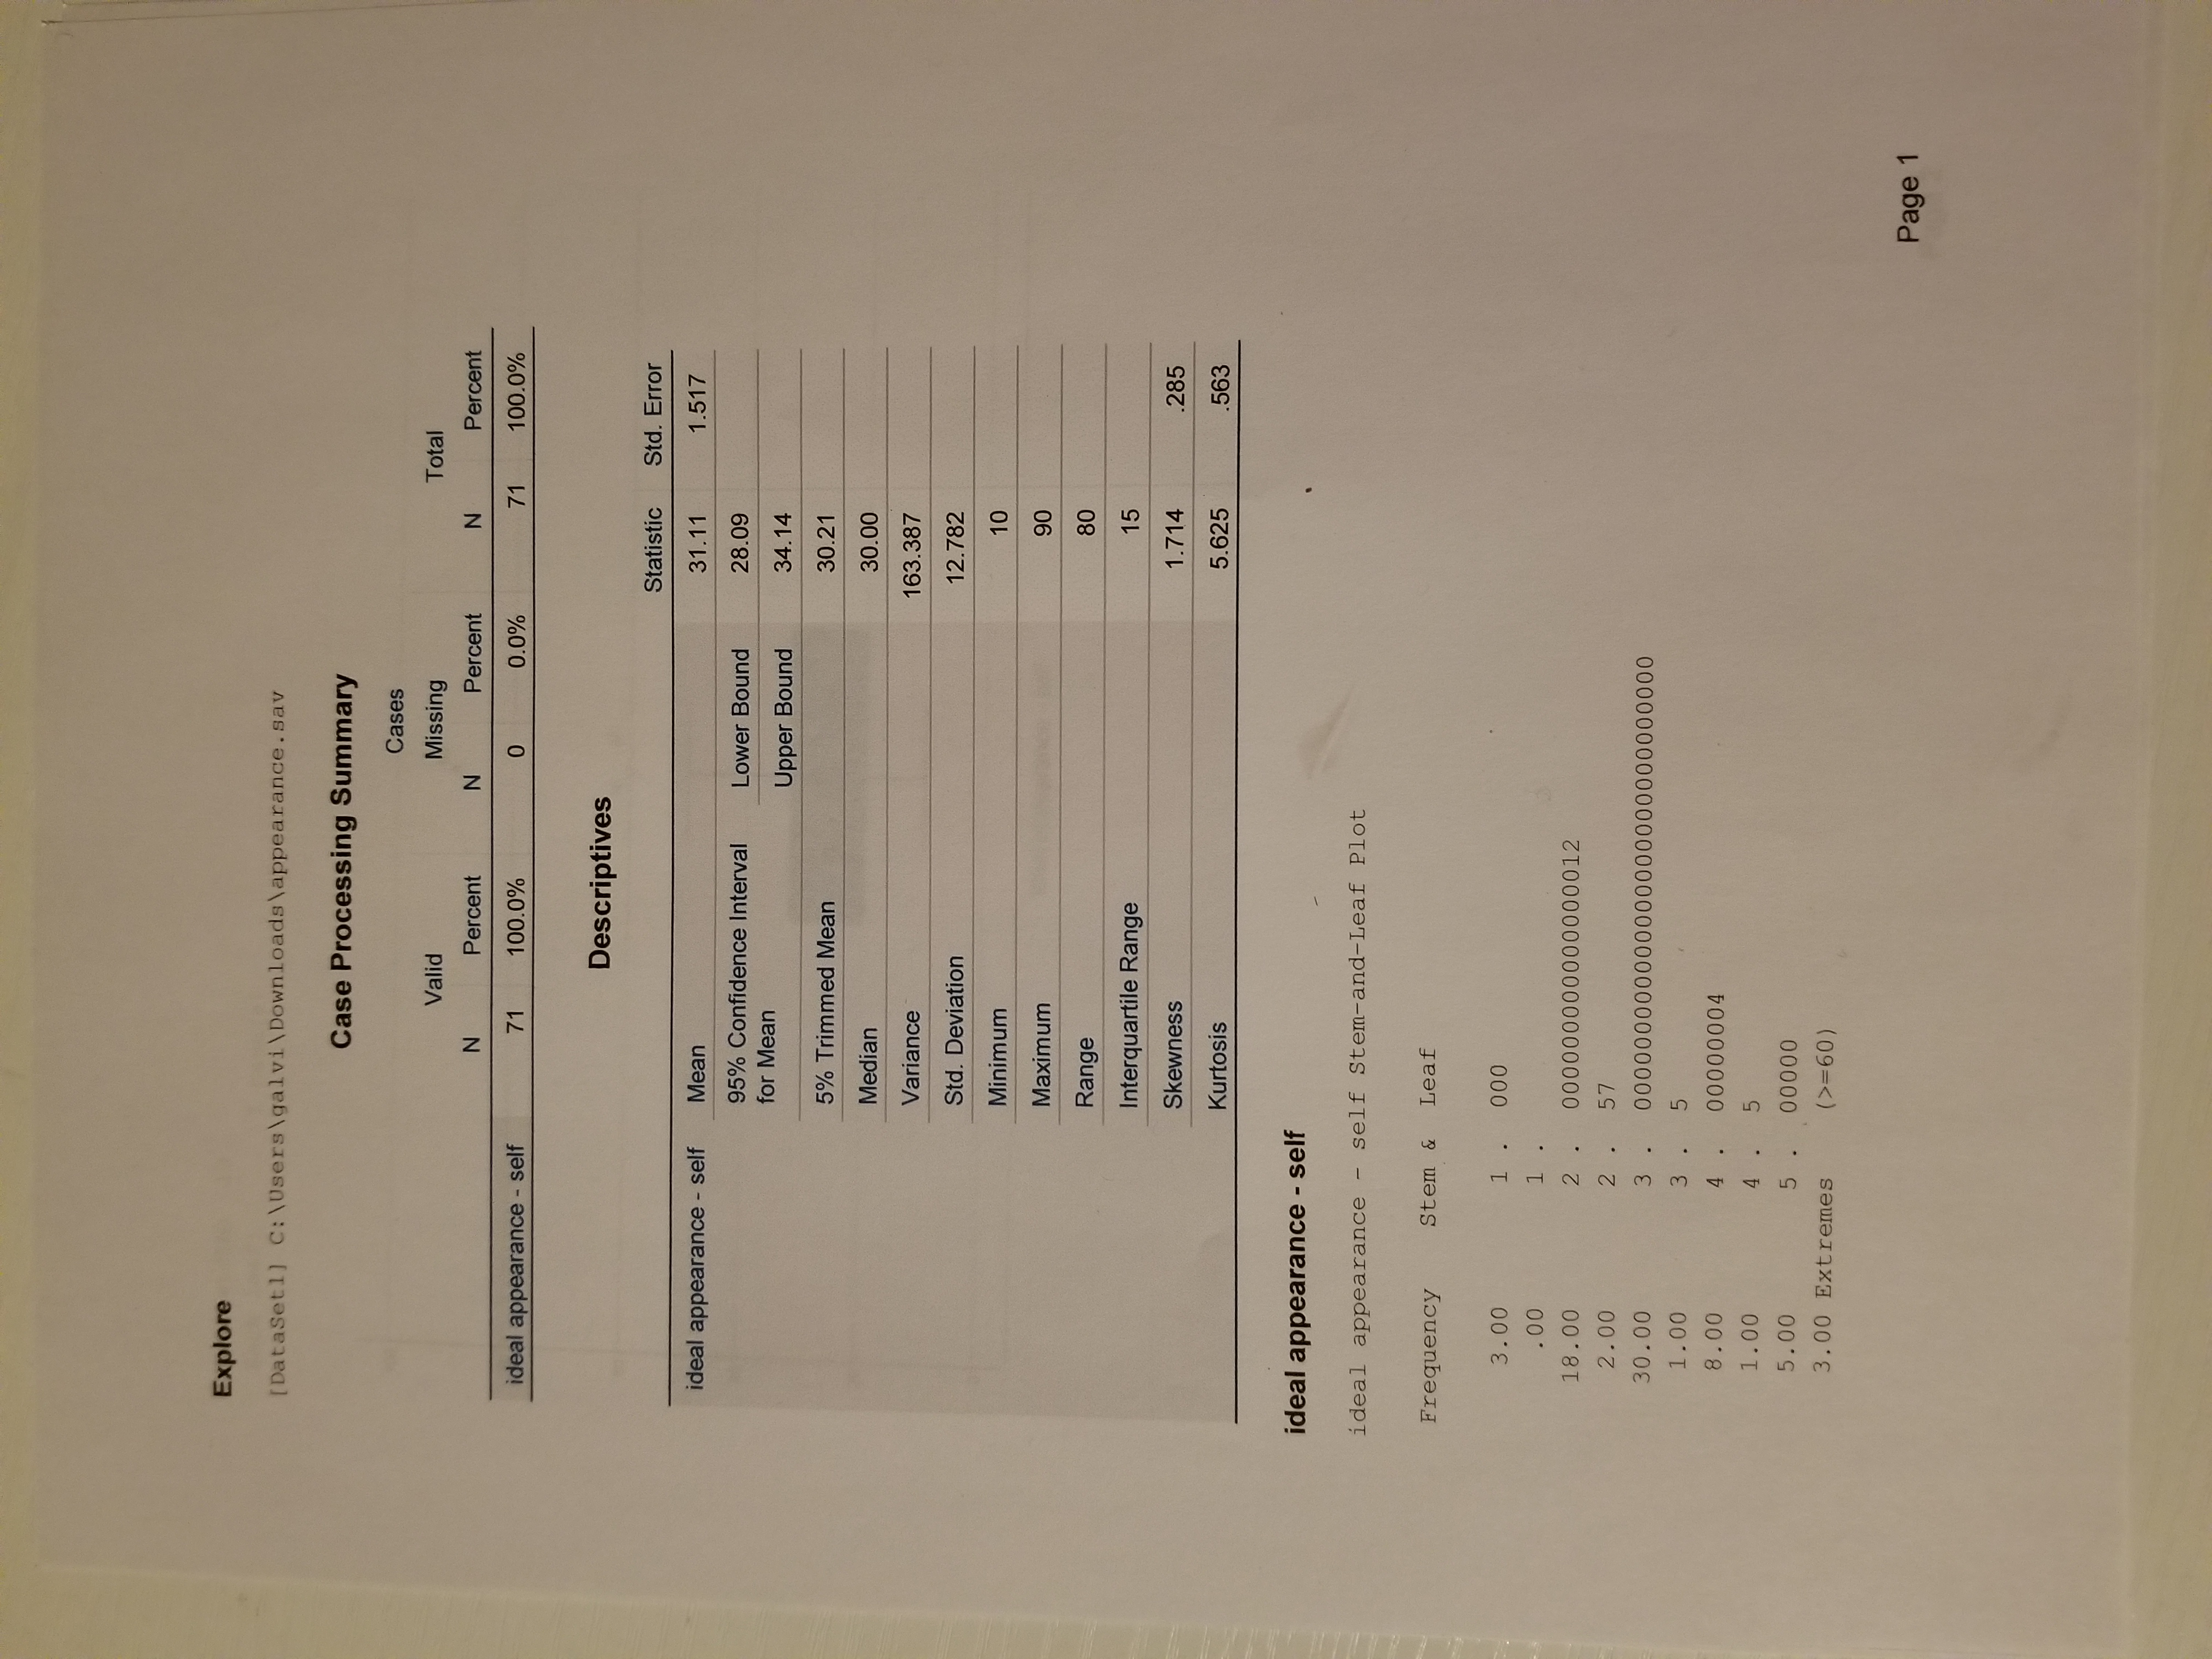
How do you narrate frequency distribution from data on SPSS? Explore [DataSet]] C: Usersgalvi Downloadsappearance . sav Case Processing Summary Cases Valid Missing Total N

How do you narrate frequency distribution from data on SPSS?

image text in transcribedimage text in transcribed
Explore [DataSet]] C: \\Users\\galvi \\Downloads\\appearance . sav Case Processing Summary Cases Valid Missing Total N Percent N Percent N Percent ideal appearance - self 71 100.0% 0 0.0% 71 100.0% Descriptives Statistic Std. Error ideal appearance - self Mean 31.11 1.517 95% Confidence Interval Lower Bound 28.09 for Mean Upper Bound 34. 14 5% Trimmed Mean 30.21 Median 30.00 Variance 163.387 Std. Deviation 12.782 Minimum 10 Maximum 90 Range 80 Interquartile Range 15 Skewness 1.714 .285 Kurtosis 5.625 563 ideal appearance - self ideal appearance - self Stem-and-Leaf Plot Frequency Stem & Leaf 3.00 000 00 18 .00 2 000000000000000012 2.00 2 57 30.00 3 0000000000000000000000000 0 0 0 0 0 1.00 3 5 8.00 00000004 1. 00 5 5.00 00000 3.00 Extremes (>= 60) Page 1

Step by Step Solution

There are 3 Steps involved in it

Step: 1

blur-text-image

Get Instant Access to Expert-Tailored Solutions

See step-by-step solutions with expert insights and AI powered tools for academic success

Step: 2

blur-text-image

Step: 3

blur-text-image

Ace Your Homework with AI

Get the answers you need in no time with our AI-driven, step-by-step assistance

Get Started

Recommended Textbook for

Graphical Approach To College Algebra

Authors: John E Hornsby, Margaret L Lial, Gary K Rockswold

6th Edition

0321900766, 9780321900760

More Books

Students also viewed these Mathematics questions

Question

Design a cross-cultural preparation program. page 313

Answered: 1 week ago

Question

Evaluate employees readiness for training. page 289

Answered: 1 week ago