How do you prepare a statement of cash flows?


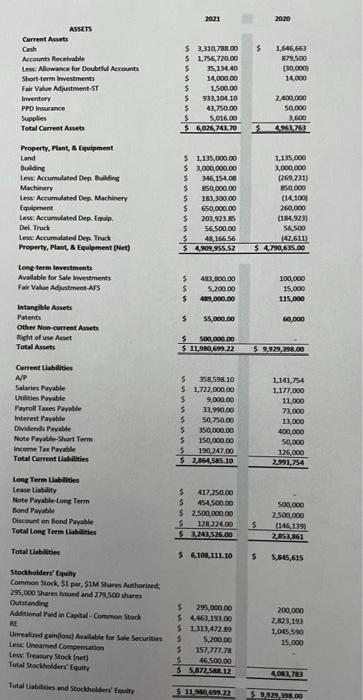
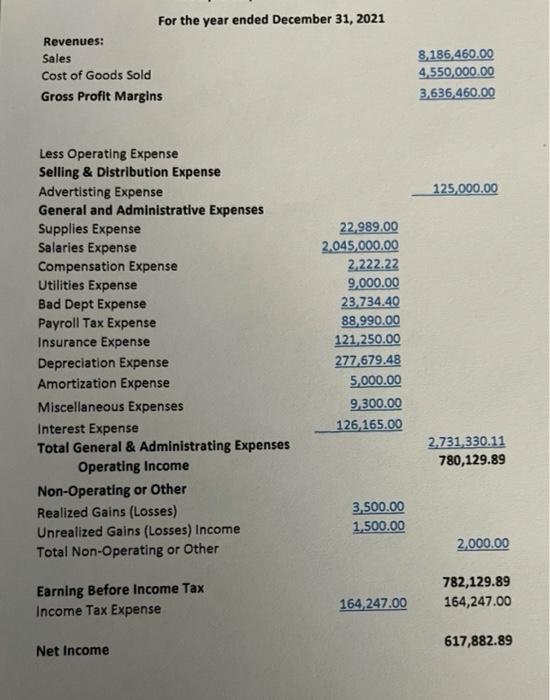
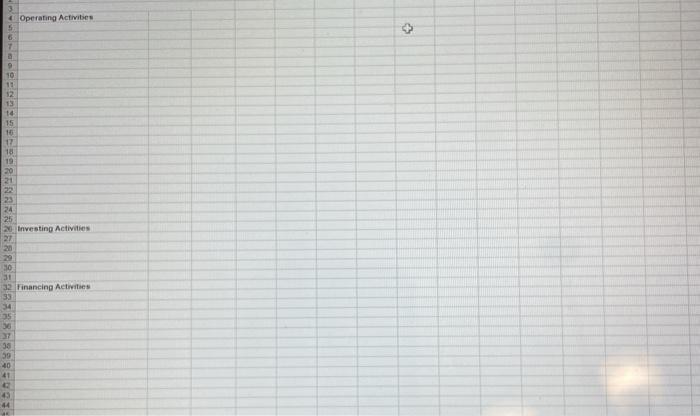
2021 2020 ASSETS Current Assets Cash Accounts Receivable Les Allowance for Doubtful Accounts Short-term Investments Fair Value Adjustment ST Inventory PPD Insurance Supplies Total Current Assets 1.646,663 879,500 (80.000 14.000 $ 3,310,788.00 $ 1756,720.00 $ 35,134.40 $ 14,000.00 $ 1.500.00 $ 933,100 10 5 43,750.00 3 5.016.00 $ 6,026, 742.70 2,400,000 50,000 3.600 4.963.763 Property. Plant & Equipment Land Building Less: Accumulated Dep. Building Machinery les: Accumulated Dep. Machinery Equipment Less: Accumulated Dep. Equip Del Truck Les Accumulated Dep. Truck Property. Plant, & Equipment (Net) Long-term investments Available for Sale Investments Fair Value Adjustment-AS $ 1,135,000.00 $3,000,000.00 $ 346,154.00 $ 850,000.00 $ 183,300.00 $ 650,000.00 $ 201,92355 5 56,500.00 $ 48, 16656 $ 4,909,955.52 1,135.000 3,000,000 269.231) 650.000 (141001 260.000 (184,923) 56,500 142.611) $ 4.790,635.00 $ $ $ 483,100.00 5.200,00 489,000.00 100,000 15.000 115,000 s 55,000.00 60,000 Intangible Assets Patents Other Non-current Assets Right of use Asset Total Assets 5 SO,000.00 $ 11,980,629.22 $ 9,929,398.00 Current Liabilities AVP Salaries Payable Utilities Payable Payroll Taxes Payable Interest Payable Dividends Payable Note Payable-Short Term Income Tax Payable Total Current Liabilities $ 358,598,10 $ 1,722,000.00 $ 9,000.00 $ 33.990.00 5 50,750.00 5 350,000.00 5 150,000.00 $ 190,247.00 $ 2,144.585.10 1,141,754 1,177,000 11,000 73,000 13,000 400,000 50,000 125,000 2.991,754 Long Term Liabilities Lease Liability Note Payable Long Term Bond Payable Discount on Bond Payable Total Long Term Liabilities $ 417,250.00 $ 454,500.00 $ 2,500,000.00 5 128 224.00 5 2.243.526.00 500,000 2.500.000 (146.139) 2.853,861 $ Total Liabilities $ 108,111.10 $ 5,845,615 Stockholders' Equity Common Stock, Sipar. 51M Shares Authorised; 295,000 Shares vued and 279,500 shares Outstanding Additional Pardin Capital - Common Stock RE Unrealed gainos Available for Sale Securities Less: Unearned Compensation Lew: Treasury Stock (net) Total Stockholders' Equity $ 295,000.00 54,463,198.00 $ 1,313,472.89 5 5,200.00 $ 157.777.78 S 46 500.00 $ 5872.58 12 200,000 2,823,193 1.045,590 15.000 40, 783 Total Liabilities and Stockholders' Equity $ 11,040699.22 $ 9929,298.00 For the year ended December 31, 2021 Revenues: Sales Cost of Goods Sold Gross Profit Margins 8,186,460.00 4,550,000.00 3,636.460.00 125,000.00 Less Operating Expense Selling & Distribution Expense Advertising Expense General and Administrative Expenses Supplies Expense Salaries Expense Compensation Expense Utilities Expense Bad Dept Expense Payroll Tax Expense Insurance Expense Depreciation Expense Amortization Expense Miscellaneous Expenses Interest Expense Total General & Administrating Expenses Operating Income Non-Operating or Other Realized Gains (Losses) Unrealized Gains (Losses) Income Total Non-Operating or Other 22,989.00 2.045,000.00 2.222.22 9,000.00 23.734.40 88,990.00 121.250.00 277,679.48 5,000.00 9,300.00 126 165.00 2.731.330.11 780,129.89 3,500.00 1.500.00 2,000.00 Earning Before Income Tax Income Tax Expense 782,129.89 164,247.00 164, 247.00 617,882.89 Net Income Operating Activities + 6 7 a 9 10 11 12 13 10 15 16 17 10 19 20 21 33 24 25 20. Investing Activities 20 30 31 32 Financing Activities 33 34 35 30 18 39 40 41 43 44 2021 2020 ASSETS Current Assets Cash Accounts Receivable Les Allowance for Doubtful Accounts Short-term Investments Fair Value Adjustment ST Inventory PPD Insurance Supplies Total Current Assets 1.646,663 879,500 (80.000 14.000 $ 3,310,788.00 $ 1756,720.00 $ 35,134.40 $ 14,000.00 $ 1.500.00 $ 933,100 10 5 43,750.00 3 5.016.00 $ 6,026, 742.70 2,400,000 50,000 3.600 4.963.763 Property. Plant & Equipment Land Building Less: Accumulated Dep. Building Machinery les: Accumulated Dep. Machinery Equipment Less: Accumulated Dep. Equip Del Truck Les Accumulated Dep. Truck Property. Plant, & Equipment (Net) Long-term investments Available for Sale Investments Fair Value Adjustment-AS $ 1,135,000.00 $3,000,000.00 $ 346,154.00 $ 850,000.00 $ 183,300.00 $ 650,000.00 $ 201,92355 5 56,500.00 $ 48, 16656 $ 4,909,955.52 1,135.000 3,000,000 269.231) 650.000 (141001 260.000 (184,923) 56,500 142.611) $ 4.790,635.00 $ $ $ 483,100.00 5.200,00 489,000.00 100,000 15.000 115,000 s 55,000.00 60,000 Intangible Assets Patents Other Non-current Assets Right of use Asset Total Assets 5 SO,000.00 $ 11,980,629.22 $ 9,929,398.00 Current Liabilities AVP Salaries Payable Utilities Payable Payroll Taxes Payable Interest Payable Dividends Payable Note Payable-Short Term Income Tax Payable Total Current Liabilities $ 358,598,10 $ 1,722,000.00 $ 9,000.00 $ 33.990.00 5 50,750.00 5 350,000.00 5 150,000.00 $ 190,247.00 $ 2,144.585.10 1,141,754 1,177,000 11,000 73,000 13,000 400,000 50,000 125,000 2.991,754 Long Term Liabilities Lease Liability Note Payable Long Term Bond Payable Discount on Bond Payable Total Long Term Liabilities $ 417,250.00 $ 454,500.00 $ 2,500,000.00 5 128 224.00 5 2.243.526.00 500,000 2.500.000 (146.139) 2.853,861 $ Total Liabilities $ 108,111.10 $ 5,845,615 Stockholders' Equity Common Stock, Sipar. 51M Shares Authorised; 295,000 Shares vued and 279,500 shares Outstanding Additional Pardin Capital - Common Stock RE Unrealed gainos Available for Sale Securities Less: Unearned Compensation Lew: Treasury Stock (net) Total Stockholders' Equity $ 295,000.00 54,463,198.00 $ 1,313,472.89 5 5,200.00 $ 157.777.78 S 46 500.00 $ 5872.58 12 200,000 2,823,193 1.045,590 15.000 40, 783 Total Liabilities and Stockholders' Equity $ 11,040699.22 $ 9929,298.00 For the year ended December 31, 2021 Revenues: Sales Cost of Goods Sold Gross Profit Margins 8,186,460.00 4,550,000.00 3,636.460.00 125,000.00 Less Operating Expense Selling & Distribution Expense Advertising Expense General and Administrative Expenses Supplies Expense Salaries Expense Compensation Expense Utilities Expense Bad Dept Expense Payroll Tax Expense Insurance Expense Depreciation Expense Amortization Expense Miscellaneous Expenses Interest Expense Total General & Administrating Expenses Operating Income Non-Operating or Other Realized Gains (Losses) Unrealized Gains (Losses) Income Total Non-Operating or Other 22,989.00 2.045,000.00 2.222.22 9,000.00 23.734.40 88,990.00 121.250.00 277,679.48 5,000.00 9,300.00 126 165.00 2.731.330.11 780,129.89 3,500.00 1.500.00 2,000.00 Earning Before Income Tax Income Tax Expense 782,129.89 164,247.00 164, 247.00 617,882.89 Net Income Operating Activities + 6 7 a 9 10 11 12 13 10 15 16 17 10 19 20 21 33 24 25 20. Investing Activities 20 30 31 32 Financing Activities 33 34 35 30 18 39 40 41 43 44


