 How does Daktronics compare to industry average in terms of financial performance? Is your analysis consistent with the stock price perforemance shown in Figure 1 of the case?
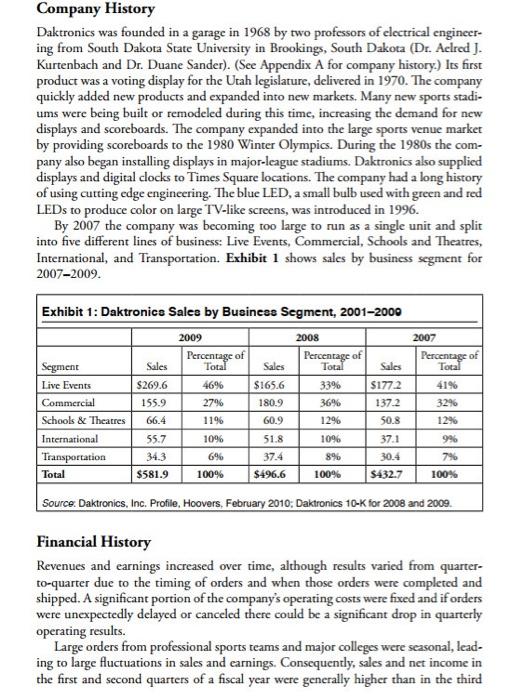
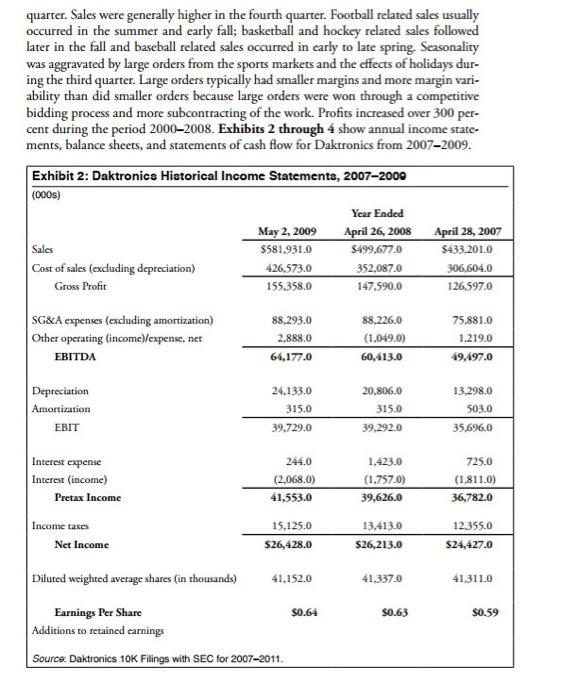
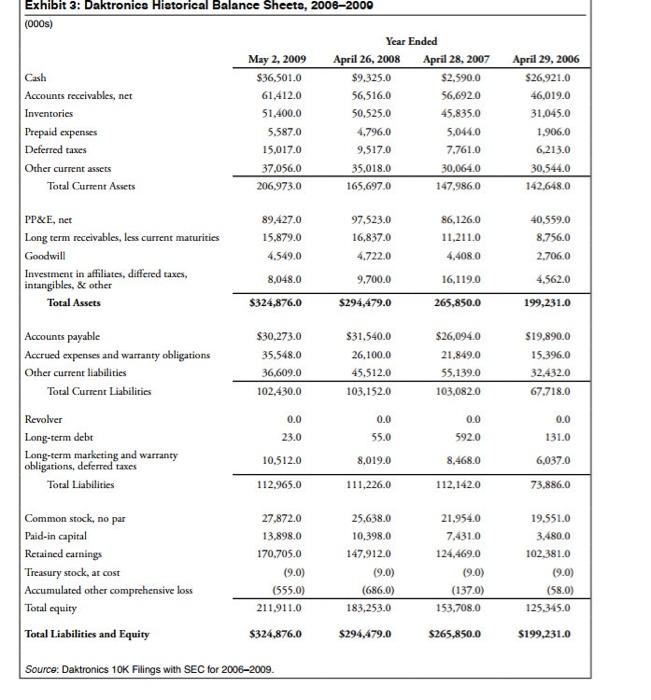
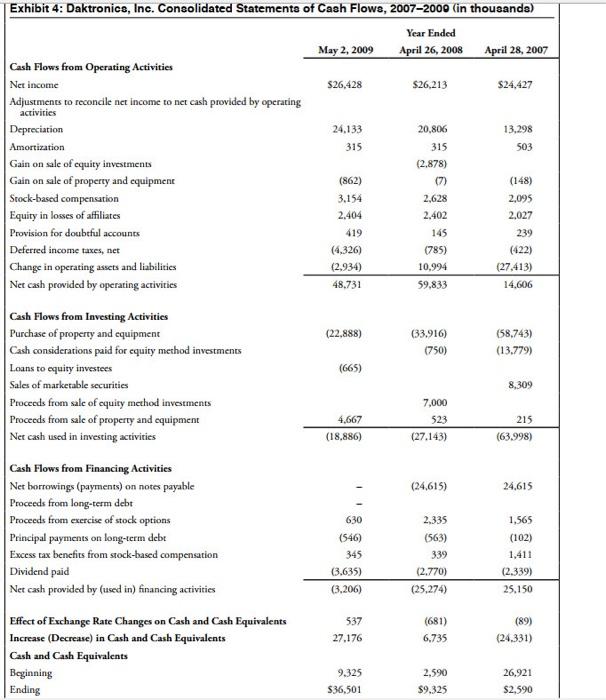
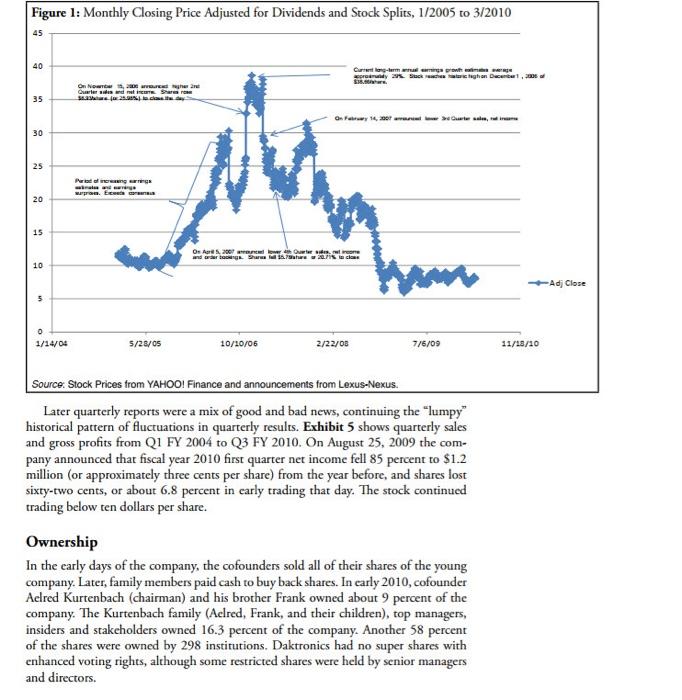
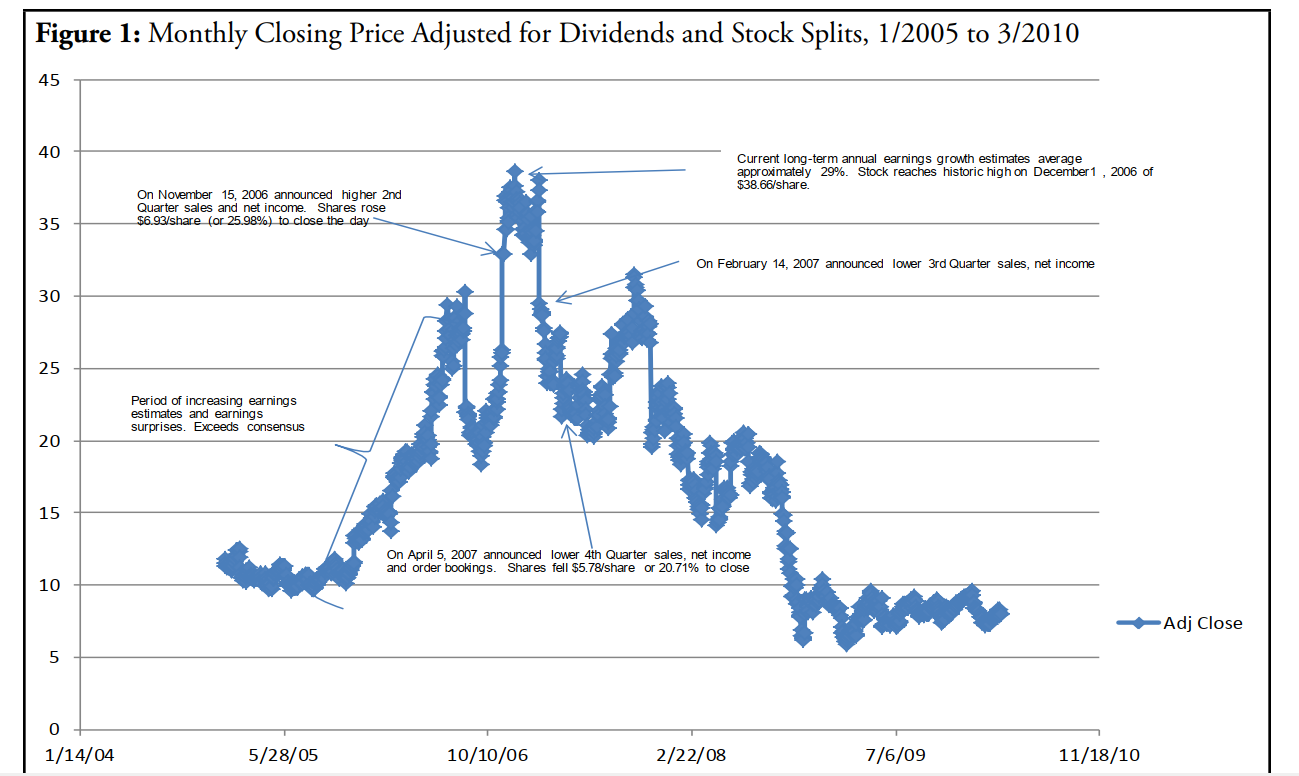
Figure 1: Monthly Closing Price Adjusted for Dividends and Stock Splits, 1/2005 to 3/2010 45 40 Current long-term annual earnings growth estimates average approximately 29%. Stock reaches historic high on December 1, 2006 of $38.66/share. On November 15, 2006 announced higher 2nd Quarter sales and net income. Shares rose $6.93/share (or 25.98%) to close the day 35 On February 14, 2007 announced lower 3rd Quarter sales, net income 30 25 Period of increasing earnings estimates and earnings surprises. Exceeds consensus 20 15 On April 5, 2007 announced lower 4th Quarter sales, net income and order bookings. Shares fell $5.78/share or 20.71% to close 10 Adj Close 5 0 1/14/04 5/28/05 10/10/06 2/22/08 7/6/09 11/18/10 Company History Daktronics was founded in a garage in 1968 by two professors of electrical engineer- ing from South Dakota State University in Brookings, South Dakota (Dr. Aelred J. Kurtenbach and Dr. Duane Sander). (See Appendix A for company history.) Its first product was a voting display for the Utah legislature, delivered in 1970. The company quickly added new products and expanded into new markets. Many new sports stadi- ums were being built or remodeled during this time, increasing the demand for new displays and scoreboards. The company expanded into the large sports venue market by providing scoreboards to the 1980 Winter Olympics. During the 1980s the com- pany also began installing displays in major-league stadiums. Daktronics also supplied displays and digital clocks to Times Square locations. The company had a long history of using cutting edge engineering. The blue LED, a small bulb used with green and red LEDs to produce color on large TV-like screens, was introduced in 1996. By 2007 the company was becoming too large to run as a single unit and split into five different lines of business: Live Events, Commercial, Schools and Theatres, International, and Transportation. Exhibit 1 shows sales by business segment for 2007-2009. Exhibit 1: Daktronics Sales by Business Segment, 2001-2000 2008 Percentage of Total 2007 Percentage of Total Sales Sales $177.2 2009 Percentage of Total 46% 27% 1196 Segment Live Events Commercial Schools & Theatres International Transportation Total $165.6 Sales $269.6 155.9 66.4 180.9 60.9 33% 36% 129 10% 896 41% 32% 1296 55.7 34.3 10% 6% 100% 51.8 37.4 $496.6 137.2 50.8 37.1 30.4 S432.7 9% 7% 100% $581.9 100% Source: Daktronics, Inc. Profile, Hoovers, February 2010: Daktronics 10-K for 2008 and 2009 Financial History Revenues and earnings increased over time, although results varied from quarter- to-quarter due to the timing of orders and when those orders were completed and shipped. A significant portion of the company's operating costs were fixed and if orders were unexpectedly delayed or canceled there could be a significant drop in quarterly operating results. Large orders from professional sports teams and major colleges were seasonal, lead- ing to large Auctuations in sales and earnings. Consequently, sales and net income in the first and second quarters of a fiscal year were generally higher than in the third quarter. Sales were generally higher in the fourth quarter. Football related sales usually occurred in the summer and early fall ; basketball and hockey related sales followed later in the fall and baseball related sales occurred in early to late spring. Seasonality was aggravated by large orders from the sports markets and the effects of holidays dur- ing the third quarter. Large orders typically had smaller margins and more margin vari- ability than did smaller orders because large orders were won through a competitive bidding process and more subcontracting of the work. Profits increased over 300 per- cent during the period 20002008. Exhibits 2 through 4 show annual income state- ments, balance sheets, and statements of cash flow for Daktronics from 2007-2009. Exhibit 2: Daktronics Historical Income Statemente, 2007-2009 (0005) Sales Year Ended April 26, 2008 $499.677.0 352.087.0 147.590.0 May 2, 2009 $581.931.0 426,573.0 155.358.0 April 28, 2007 S433.2010 306,604.0 126,597.0 Cost of sales (excluding depreciation) Gross Profit SG&A expenses (excluding amortization) Other operating (income)/expense, net EBITDA 88,293.0 2.888.0 64,177.0 88.226.0 (1,049.0) 60,413.0 75,881.0 1.219.0 49,497.0 Depreciation Amortization EBIT 24.133.0 315.0 39.729.0 20,806.0 315.0 13.298.0 503.0 35.696.0 39,292.0 Interest expense Interest (income) Pretax Income 244.0 (2,068.0) 41,553.0 1.423.0 (1.757.0) 39,626.0 725.0 (1.811.0) 36,782.0 Income taxes Net Income 15.125.0 $26,428.0 13.413.0 $26,213.0 12.355.0 S24,427.0 Diluted weighted average shares (in thousands) 41,152.0 41.337.0 41.311.0 $0.64 $0.63 $0.59 Earnings Per Share Additions to retained earnings Source: Daktronics 10K Filings with SEC for 2007-2011 Exhibit 3: Daktronics Historical Balance Sheete, 2006-2000 (000s) Year Ended May 2, 2009 April 26, 2008 April 28, 2007 Cash $36,501.0 $9.325.0 $2.590.0 Accounts receivables, net 61,412.0 56,516.0 56,692.0 Inventories 51,400.0 50,525.0 45,835.0 Prepaid expenses 5.587.0 4.796.0 5,044.0 Deferred taxes 15,017.0 9.517.0 7.761.0 Other current assets 37,056.0 35,018.0 30,064.0 Total Current Assets 206,973.0 165,697.0 147.986.0 April 29, 2006 $26,921.0 46,019.0 31,045.0 1.906.0 6,213.0 30.544.0 142.648.0 89.427.0 97,523.0 16,837.0 4.722.0 86,126.0 11,211.0 15.879.0 4.549.0 40.559.0 8.756.0 2.706,0 4,408.0 PP&E, net Long term receivables, less current maturities Goodwill Investment in affiliates, differed taxes, intangibles, & other Total Assets 16,119.0 4.562.0 8,048.0 $324,876.0 9.700.0 $294,479.0 265,850.0 199,231.0 $26,094.0 Accounts payable Accrued expenses and warranty obligations Other current liabilities Total Current Liabilities $30,273.0 35.548.0 36,609.0 102,430.0 $31.540.0 26,100.0 45,512.0 103,152.0 21.849.0 55.139.0 103,082.0 $19.890.0 15.396.0 32.432.0 67.718.0 0.0 0.0 0.0 0.0 23.0 55.0 592.0 131.0 Revolver Long-term debt Long-term marketing and warranty obligations, deferred taxes Total Liabilities 10,512.0 8.019.0 8,468.0 6,037.0 112,965.0 111,226.0 112,142.0 73.886.0 Common stock, no par Paid-in capital Retained earnings Treasury stock, at cost Accumulated other comprehensive loss Total equity Total Liabilities and Equity 27,872.0 13.898.0 170.705.0 (9.0) (555.0) 211,911.0 25.638.0 10,398.0 147.912.0 (9.0) (686.0) 183,253.0 21.954.0 7.431.0 124,469.0 (9.0) (137.0) 153.708.0 19.551.0 3,480,0 102.381.0 (9.0) (58.0) 125.345.0 $324,876.0 $294.479.0 $265,850.0 $199.231.0 Source: Daktronics 10K Filings with SEC for 2006-2009. Exhibit 4: Daktronics, Inc. Consolidated Statements of Cash Flows, 2007-2000 (in thousanda) May 2, 2009 Year Ended April 26, 2008 April 28, 2007 $26,428 $26,213 $24,427 24,133 315 13.298 503 Cash Flows from Operating Activities Net income Adjustments to reconcile net income to net cash provided by operating activities Depreciation Amortization Gain on sale of equity investments Gain on sale of property and equipment Stock-based compensation Equity in losses of affiliates Provision for doubtful accounts Deferred income taxes, net Change in operating assets and liabilities Net cash provided by operating activities (862) 3.154 2,404 419 (4,326) (2.934) 48.731 20,806 315 (2.878) (7) 2,628 2.402 145 (785) 10.994 59.833 (148) 2,095 2.027 239 (422) (27,413) 14,606 (22,888) (33.916) (750) 658,743) (13.779) (665) Cash Flows from Investing Activities Purchase of property and equipment Cash considerations paid for equity method investments Loans to equity investees Sales of marketable securities Proceeds from sale of equity method investments Proceeds from sale of property and equipment Net cash used in investing activities 8,309 4,667 (18.886) 7,000 523 (27.143) 215 (63.998) (24,615) 24,615 1,565 Cash Flows from Financing Activities Net borrowings (payments) on notes payable Proceeds from long-term debt Proceeds from exercise of stock options Principal payments on long-term debe Excess tax benefits from stock-based compensation Dividend paid Net cash provided by (used in) financing activities Effect of Exchange Rate Changes on Cash and Cash Equivalents Increase (Decrease) in Cash and Cash Equivalents Cash and Cash Equivalents Beginning Ending 630 (546) 345 (3.635) (3,206) 2,335 (563) 339 (2.770) (25,274) (102) 1,411 (2.339) 25,150 537 27.176 (681) 6.735 (89) (24.331) 9.325 $36,501 2,590 $9.325 26,921 $2.590 Stock Price History Daktronics' stock price started a steady increase beginning in 1999. The company had a reputation for high growth in earnings, and earnings surprises (higher than expecta- tions). An online report by Zacks in 2006 noted, Daktronics, Inc. is experiencing increasing earnings estimates and has a history of earnings surprises, ... [t]he company has exceeded the consensus estimate in each of the past three quarters by an average margin of about 14 percent. This year's estimates have also increased by about 3 per- cent over the past 30 days." Stock price increases led to 2-for-1 stock splits in 2001 and again in 2006. In a November 2006 stock report on Daktronics, the Value Line Investment Survey, noting recent high-profile contracts signed with the Kansas City Royals and Auburn Univer- sity for stadium scoreboards and displays, estimated carnings growth for fiscal 2008 in the 20-25 percent range. On November 15, 2006, shares rose $6.93 per share, or approximately 26 percent, on the company's announcement of a 63 percent increase in second quarter sales and higher net income. In the same release, they reported that order bookings in the Commercial segment were up 75 percent year-to-date, that sports orders were up more than 45 percent and that revenues in the Transportation unit were up over 60 percent for the quarter and the year. But doubts about the company's future performance started to surface in Decem- ber 2006 when Anders Bylund of Motley Fool wrote an online article arguing that the stock was overvalued and that recent consensus earnings growth estimates of around 29 percent at the time were not sustainable, and that the earnings multiples being applied by investors were unrealistic. "Daktronics' stock trades at 4 times revenues and 62 times earnings, not to mention 10.7 times the company's book value. All of these multiples are beyond any reasonable comparison to the current or prospective competition, and richer than at any point in the history of Daktronics," he wrote. "I think the current valuation is simply untenable, and the market will punish it-hard." On February 14, 2007 a company announcement lowering estimated sales, carn- ings, and order backlog started a swift decline in stock price that, as of March 2010, had yet to be reversed. Share price fell by S8 per share, or about 21 percent, by the dose on February 14. On April 4, 2007, two months into its fiscal 2007 fourth quar- ter, Daktronics announced lower projections of revenues and earnings for the quarter, citing insufficient order bookings to generate carlier sales estimates, and share price fell $5.78 per share or about 20 percent. In a February 1, 2008 report, Value Line cut its sales and carnings estimates for Daktronics, citing problems at one of the plants in the company's supply chain for the Galaxy line of billboards. Although management reported that the problem had been fixed, Value Line was concerned that the problem would affect order bookings and future sales. Share price was down more than 30 percent from the date of the Value Line report one year earlier, with most of the decline occurring after the company released lower results in October, 2007. In May 2008, the company reported that sales rose 11 percent over the previous year, but net income fell by 24 percent due to higher than expected payroll-related expenses. The company also reported that it was slowing its hiring rate and taking steps to better manage employee-related costs. The company lowered its guidance for fiscal fourth quarter sales and earnings per share. Figure 1: Monthly Closing Price Adjusted for Dividends and Stock Splits, 1/2005 to 3/2010 45 40 Current german Sprey Sack Waterhon Dece 18. 35 On Her 14, 10 are Quarter and more Srem Seashell 24.005... On Pawar unter sale, 30 25 Page miner werpron. Exceda 20 15 Os r.2007 www.wrone and their 10 -Adj Close 5 o 1/14/04 5/28/05 10/10/06 2/22/05 7/6/09 11/18/10 Source: Stock Prices from YAHOO! Finance and announcements from Lexus-Nexus. Later quarterly reports were a mix of good and bad news, continuing the lumpy historical pattern of fluctuations in quarterly results. Exhibit 5 shows quarterly sales and gross profits from Q1 FY 2004 to Q3 FY 2010. On August 25, 2009 the com- pany announced that fiscal year 2010 first quarter net income fell 85 percent to $1.2 million (or approximately three cents per share) from the year before and shares lost sixty-two cents, or about 6.8 percent in carly trading that day. The stock continued trading below ten dollars per share. Ownership In the early days of the company, the cofounders sold all of their shares of the young company. Later, family members paid cash to buy back shares. In carly 2010, cofounder Aelred Kurtenbach (chairman) and his brother Frank owned about 9 percent of the company. The Kurtenbach family (Aelred, Frank, and their children), top managers, insiders and stakeholders owned 16.3 percent of the company. Another 58 percent of the shares were owned by 298 institutions. Daktronics had no super shares with enhanced voting rights, although some restricted shares were held by senior managers and directors