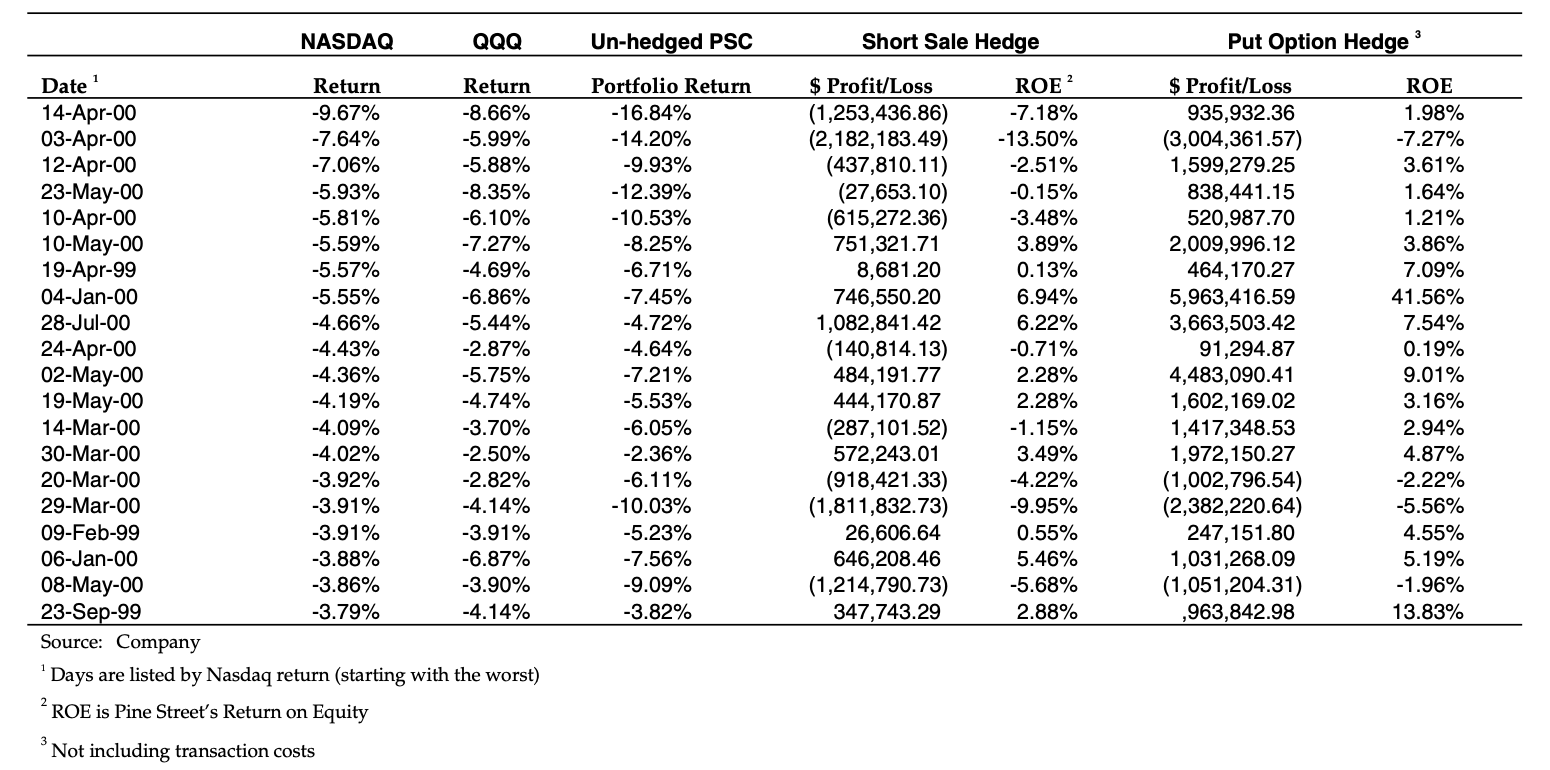
How does the performance of the short-sale hedging strategy compare to the hedging strategy with put options during the worst 20 days for NASDAQ over the period January 4, 2000 to July 28, 2000?

NASDAQ QQQ 3 Un-hedged PSC Short Sale Hedge Put Option Hedge Date Return Return 14-Apr-00 -9.67% -8.66% 03-Apr-00 -7.64% -5.99% 12-Apr-00 -7.06% -5.88% 23-May-00 -5.93% -8.35% 10-Apr-00 -5.81% -6.10% 10-May-00 -5.59% -7.27% 19-Apr-99 -5.57% -4.69% 04-Jan-00 -5.55% -6.86% 28-Jul-00 -4.66% -5.44% 24-Apr-00 -4.43% -2.87% 02-May-00 -4.36% -5.75% 19-May-00 -4.19% -4.74% 14-Mar-00 -4.09% -3.70% 30-Mar-00 -4.02% -2.50% 20-Mar-00 -3.92% -2.82% 29-Mar-00 -3.91% -4.14% 09-Feb-99 -3.91% -3.91% 06-Jan-00 -3.88% -6.87% 08-May-00 -3.86% -3.90% 23-Sep-99 -3.79% -4.14% Source: Company Days are listed by Nasdaq return (starting with the worst) 2 ROE is Pine Street's Return on Equity 3 Not including transaction costs Portfolio Return -16.84% -14.20% -9.93% -12.39% -10.53% -8.25% -6.71% -7.45% -4.72% -4.64% -7.21% -5.53% -6.05% -2.36% -6.11% -10.03% -5.23% -7.56% -9.09% -3.82% $ Profit/Loss (1,253,436.86) (2,182, 183.49) (437,810.11) (27,653.10) (615,272.36) 751,321.71 8,681.20 746,550.20 1,082,841.42 (140,814.13) 484,191.77 444,170.87 (287,101.52) 572,243.01 (918,421.33) (1,811,832.73) 26,606.64 646,208.46 (1,214,790.73) 347,743.29 ROE -7.18% -13.50% -2.51% -0.15% -3.48% 3.89% 0.13% 6.94% 6.22% -0.71% 2.28% 2.28% -1.15% 3.49% -4.22% -9.95% 0.55% 5.46% -5.68% 2.88% $ Profit/Loss 935,932.36 (3,004,361.57) 1,599,279.25 838,441.15 520,987.70 2,009,996.12 464,170.27 5,963,416.59 3,663,503.42 91,294.87 4,483,090.41 1,602,169.02 1,417,348.53 1,972,150.27 (1,002,796.54) (2,382,220.64) 247,151.80 1,031,268.09 (1,051,204.31) ,963,842.98 ROE 1.98% -7.27% 3.61% 1.64% 1.21% 3.86% 7.09% 41.56% 7.54% 0.19% 9.01% 3.16% 2.94% 4.87% -2.22% -5.56% 4.55% 5.19% -1.96% 13.83% NASDAQ QQQ 3 Un-hedged PSC Short Sale Hedge Put Option Hedge Date Return Return 14-Apr-00 -9.67% -8.66% 03-Apr-00 -7.64% -5.99% 12-Apr-00 -7.06% -5.88% 23-May-00 -5.93% -8.35% 10-Apr-00 -5.81% -6.10% 10-May-00 -5.59% -7.27% 19-Apr-99 -5.57% -4.69% 04-Jan-00 -5.55% -6.86% 28-Jul-00 -4.66% -5.44% 24-Apr-00 -4.43% -2.87% 02-May-00 -4.36% -5.75% 19-May-00 -4.19% -4.74% 14-Mar-00 -4.09% -3.70% 30-Mar-00 -4.02% -2.50% 20-Mar-00 -3.92% -2.82% 29-Mar-00 -3.91% -4.14% 09-Feb-99 -3.91% -3.91% 06-Jan-00 -3.88% -6.87% 08-May-00 -3.86% -3.90% 23-Sep-99 -3.79% -4.14% Source: Company Days are listed by Nasdaq return (starting with the worst) 2 ROE is Pine Street's Return on Equity 3 Not including transaction costs Portfolio Return -16.84% -14.20% -9.93% -12.39% -10.53% -8.25% -6.71% -7.45% -4.72% -4.64% -7.21% -5.53% -6.05% -2.36% -6.11% -10.03% -5.23% -7.56% -9.09% -3.82% $ Profit/Loss (1,253,436.86) (2,182, 183.49) (437,810.11) (27,653.10) (615,272.36) 751,321.71 8,681.20 746,550.20 1,082,841.42 (140,814.13) 484,191.77 444,170.87 (287,101.52) 572,243.01 (918,421.33) (1,811,832.73) 26,606.64 646,208.46 (1,214,790.73) 347,743.29 ROE -7.18% -13.50% -2.51% -0.15% -3.48% 3.89% 0.13% 6.94% 6.22% -0.71% 2.28% 2.28% -1.15% 3.49% -4.22% -9.95% 0.55% 5.46% -5.68% 2.88% $ Profit/Loss 935,932.36 (3,004,361.57) 1,599,279.25 838,441.15 520,987.70 2,009,996.12 464,170.27 5,963,416.59 3,663,503.42 91,294.87 4,483,090.41 1,602,169.02 1,417,348.53 1,972,150.27 (1,002,796.54) (2,382,220.64) 247,151.80 1,031,268.09 (1,051,204.31) ,963,842.98 ROE 1.98% -7.27% 3.61% 1.64% 1.21% 3.86% 7.09% 41.56% 7.54% 0.19% 9.01% 3.16% 2.94% 4.87% -2.22% -5.56% 4.55% 5.19% -1.96% 13.83%


