

Question: The following table shows the production of an economy for two goods (X and Y) and their respective prices from 2015-2018. Suppose the base
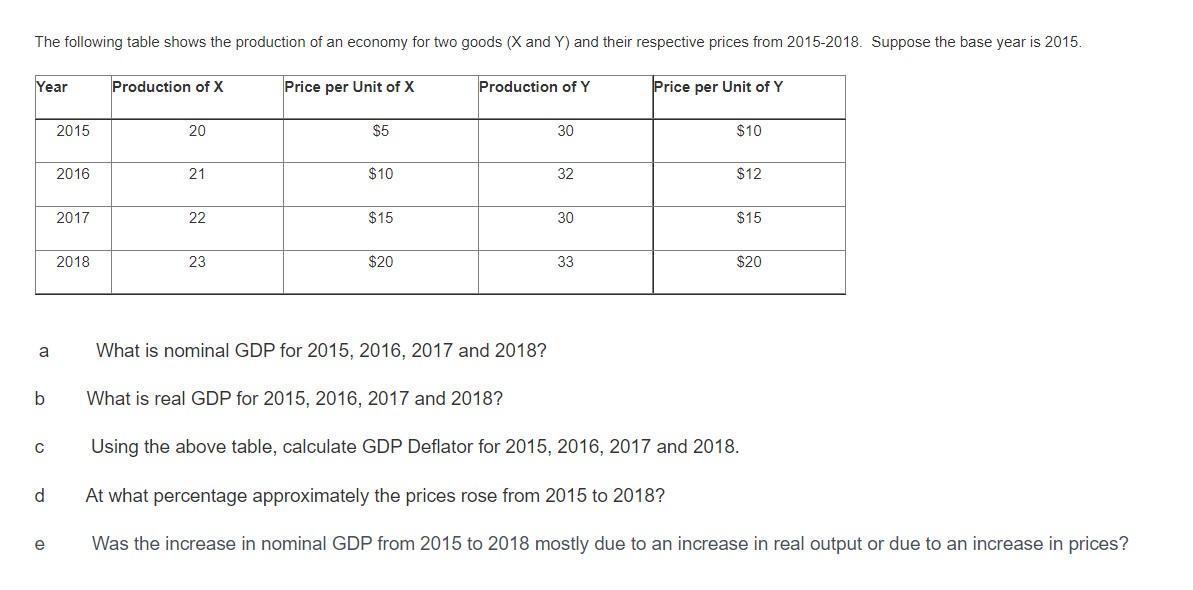
The following table shows the production of an economy for two goods (X and Y) and their respective prices from 2015-2018. Suppose the base year is 2015. Price per Unit of X Price per Unit of Y Year a b C d e 2015 2016 2017 2018 Production of X 20 21 22 23 $5 $10 $15 $20 Production of Y What is nominal GDP for 2015, 2016, 2017 and 2018? What is real GDP for 2015, 2016, 2017 and 2018? 30 32 30 33 $10 $12 $15 $20 Using the above table, calculate GDP Deflator for 2015, 2016, 2017 and 2018. At what percentage approximately the prices rose from 2015 to 2018? Was the increase in nominal GDP from 2015 to 2018 mostly due to an increase in real output or due to an increase in prices?
Step by Step Solution
3.50 Rating (150 Votes )
There are 3 Steps involved in it
A a Nominal GDP for 2015 2016 2017 and 2018 2015 20 x 10 30 x 10 500 2016 22 x 15 3... View full answer

Get step-by-step solutions from verified subject matter experts