

Question
How much of the FCF did Rhodes use for each of the following purposes: after-tax interest, net debt repayments, dividends, net stock repurchases, and net
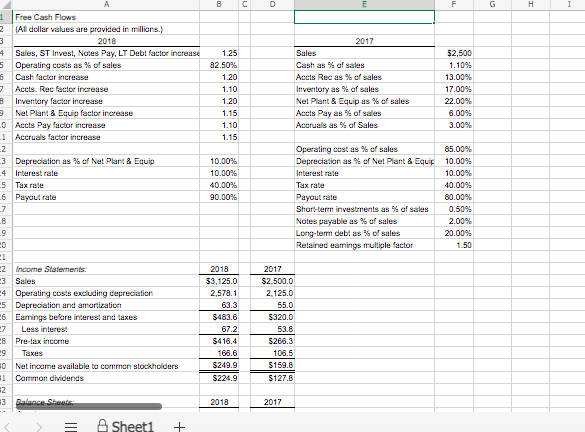
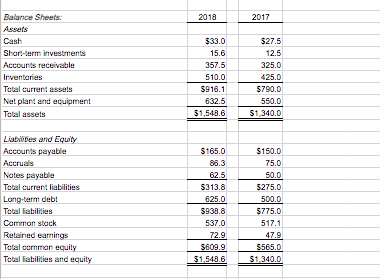
How much of the FCF did Rhodes use for each of the following purposes: after-tax interest, net debt repayments, dividends, net stock repurchases, and net purchases of short-term investments? (Hint: Remember that a net use can be negative.) Enter your answers in millions. For example, an answer of $1.2 million should be entered as 1.2, not 1,200,000. Do not round intermediate calculations. Round your answers to one decimal place.
B D F H H 1 Free Cash Flows 2 (Al dollar values are provided in millions.) 3 2018 4 Sales, ST Invest, Nodes Pay, LT Debt factor increase 5 Operating costs as % of sales 5 Cash factor increase 7 Accts. Rec factor increase 8 Inventory factor increase Net Plan! & Equip factor increase O Accts Pay factor increase 1 Accruals factor increase 2 3 Depreciation as % of Net Plant & Equip 4 Interest rate -5 Tax rate -6 Payout rate 7 8 1.25 82.50% 1.20 1.10 1.20 1.15 1.10 1.15 2017 Sales Cash as % of sales Accts Rec as % of sales Inventory as % of sales Net Plant & Equip as % of sales Accts Pay as % of sales Accruals as % af Sales $2,500 1.10% 13.00% 17.00% 22.00% 6.00% 3.00% 10.00% 10.00% 40.00% 90.00% Operating cost as % of sales 85.00% Depreciation as % of Net Plant & Equip 10.00% Interest rate 10.00% Tax rata 40.00% Payout rale 80.00% Short-term investments as of sales 0.50% Noles payable as % of sales 2.00% Long-term debt as % of sales 20.00% Relained earnings multiple factor 1.50 20 21 -2 Income Statements. 23 Sales 24 Operating costs excluding depreciation 5 Depreciation and amortization 6 Earrings before interest and taxes 27 Less interest 8 Pre-lax income 9 Taxes 0 Net income available to common stockholders 1 Common dividends 2 3 Balance Sheets 2018 $3,125.0 2.578.1 63.3 $483.6 67.2 S416.4 168.6 $249.9 5224.9 2017 $2.500.0 2.125.0 55.0 $320.0 53.6 $268.3 106.5 $159.8 $127.8 2018 2017 Sheet1 + 2018 2017 Balance Sheets Assets Cash Short-term investments Accounts receivable Inventaries Total current assets Net plant and equipment Total assets $33.0 15.6 357.5 510.0 $916.1 632.5 $1,549.6 $27.5 12.5 325.0 425.0 5790.0 550.0 $1,340.0 Listies and Equity Accounts payable Accruals Notes payable Total current liabilities Long-term debt Total liabilities Common stock Retained earnings Total common equity Total abilities and equity $165.0 88.3 62.5 $313.8 625.0 $938.8 537.0 72.9 $609.9 $1.548.6 $150.0 75.0 50.0 $275.0 500.0 5775.0 517.1 47.9 5565.0 $1,340.0Step by Step Solution
There are 3 Steps involved in it
Step: 1

Get Instant Access to Expert-Tailored Solutions
See step-by-step solutions with expert insights and AI powered tools for academic success
Step: 2

Step: 3
Ace Your Homework with AI
Get the answers you need in no time with our AI-driven, step-by-step assistance
Get Started
Options Trading 12 Books In 1 Elevate Your Profits Erase Risks The Definitive Guide From Rookie To Top 1 Trader
Authors: Warren Ray Benjamin
1st Edition
979-8860106413